4.2 Strain and Strain Rate Measurement: Distributed Acoustic Sensing (DAS)
The use of Rayleigh-based Distributed Acoustic Sensing (DAS) has recently gained prominence in the earth sciences arena. Unlike Raman or Brillouin measuring methods, which rely upon measuring the production of inelastic scattered photons, DAS uses elastically scattered Rayleigh photons to infer the rate of length change (strain) of the optical fiber. Rayleigh scattering resulting from minor heterogeneities in the refractive index is more common than Raman or Brillouin scattering and therefore provides a much larger return signal per unit time.
In a DAS system, a laser is cycled at 10 kHz or greater, and the backscattered photons return to the detector as a function of their distance down the fiber (Daley et al., 2015, Lindsey et al., 2017). The phase shift between the photons scattered from different distances down the fiber is computed for each laser pulse. To calculate the changes in fiber length over time, or strain rate, the phase shift from one laser pulse is compared to the next laser pulse, and the change in phase shift is computed. Because the rate of strain (change in length per unit time) is approximately linear to the phase shift between these two photon trains, the change in spacing between any two scattering sites can be determined (Daley et al., 2015). As an example, if there is no fiber strain between time 1 and time 2, there will be no change in the phase shift for these two pulses. However, if a section of the fiber changes length between time 1 and time 2, then there will be a difference in phase shift observed for photons returning from this part of the fiber. For the typical laser repetition rate, the change in spacing or strain rate can be determined at frequencies well into the audible range (10 kHz) and as low as 0.1 Hz and lower (Becker et al., 2017). Typical DAS instruments today can resolve phase shifts over lengths of fiber no shorter than ~10 m, and this measurement support scale is typically termed the instrument’s gauge length or minimum resolvable fiber length for which a strain rate can be recovered.
DAS has been widely used in acoustic monitoring due to its very wide frequency sensitivity. In seismology, DAS is now widely used in the frequency range of earthquakes (1-10 Hz), hydrofracking, and in active seismic refraction and reflection (> 20 Hz). Lindsey and others (2019) used an undersea telecommunications cable to capture both high-frequency seismic events from previously unknown features but also much lower-frequency waves, tides and storm-driven sediment transport. Li and others (2021) provide greater details of DAS application across geophysical topics.
Because DAS measures the rate of change of length between two points on the fiber, the applied stress must induce a longitudinal change in length to be measured. This makes DAS quite applicable to measuring vertical strain in boreholes driven by groundwater pumping and subsidence. In their 2017 paper, Becker and others developed an oscillatory groundwater pumping system deployed in fractured granite to test the low frequency response of DAS fibers to pumping-induced strain. Induced stress at ~0.01 to 0.001 Hz frequencies produced only several centimeters of head change in the aquifer; however, vertical strain of up to 0.1 nm/m or 0.1 nanostrain could be recorded. Figure 11 documents the small head changes in the borehole and the resulting vertical strain recorded on the fiber in the pumping well.
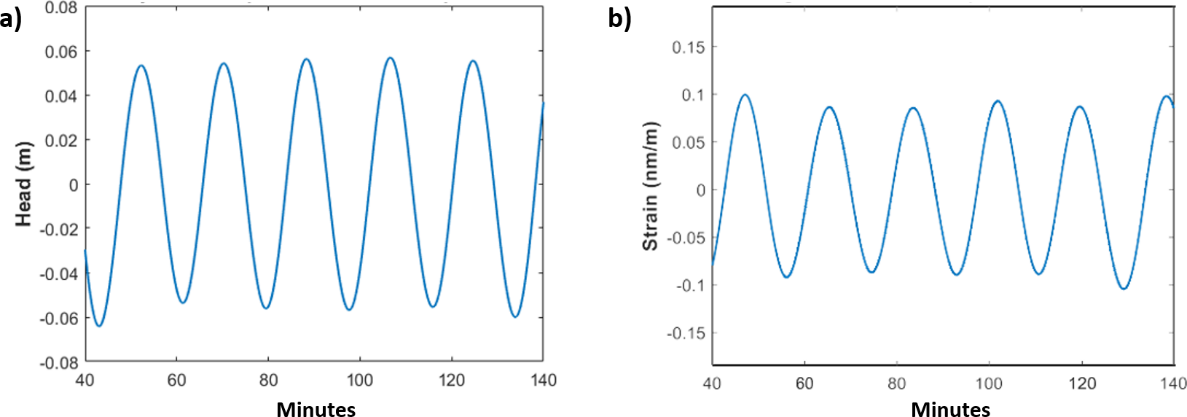
Figure 11 – Small head changes in the borehole and the resulting vertical strain recorded on the fiber in the pumping well: a) filtered head response measured in the stressed fracture induced by pumping; and, b) observed filtered DAS strain response at the same fracture. The strain is coincident in time with the pumping and shows the dilation and contraction of the fracture in response to fluid pressure changes (Becker et al., 2017).
While this work required a modulated period driving signal (pumping) to infer the small rates of strain, many hydrogeologic stresses (earth tides, daily and seasonal groundwater pumping, flood irrigation) can be considered or designed to be quasi-periodic. Using these natural and induced stresses to infer geomechanically and hydraulic characteristics of aquifers represents a unique opportunity to obtain these characteristics at a large scale but with high spatial resolution.
Tribaldos and others (2021) successfully demonstrated that DAS could be used to monitor aquifer storage changes over large regions. Using ambient seismic noise (from automobiles and train passages) as the input energy source, the authors monitored temporal changes in seismic velocities over a 23-km long unused (“dark”) telecommunications fiber in the vicinity of the Sacramento River in central California, USA. Seismic velocity changes were observed near the river during river stage changes of ~1.5 m, as well as during periods of recharge from precipitation. The changes in seismic velocity were attributed to changes in pore pressures due to stage change or precipitation loading in the upper 10-30 meters of the aquifer. Figure 12 demonstrates the strong correlation between river stage (taken as a proxy for local groundwater levels) and the seismic velocities in the sediments adjacent to the river. Unlike point measurements, such as piezometers that provide only limited views of the aquifer response, the use of dark fiber DAS provides estimates of aquifer storage change at high spatial resolution and across very large areas. The use of DAS for large-scale aquifer monitoring in urban/suburban environments appears very promising, as buried, and unused (dark) fiber is common in urban environments. Ambient seismic noise is also ubiquitous in urban areas, and many metropolitan regions rely upon local aquifers for an important portion of their drinking water supply. These approaches may also be appropriate for more rural areas where groundwater is extensively used for irrigation, as many rural areas are transected by rail and road networks (for ambient noise) and buried telecommunication fiber commonly shares rights of way with such infrastructure.
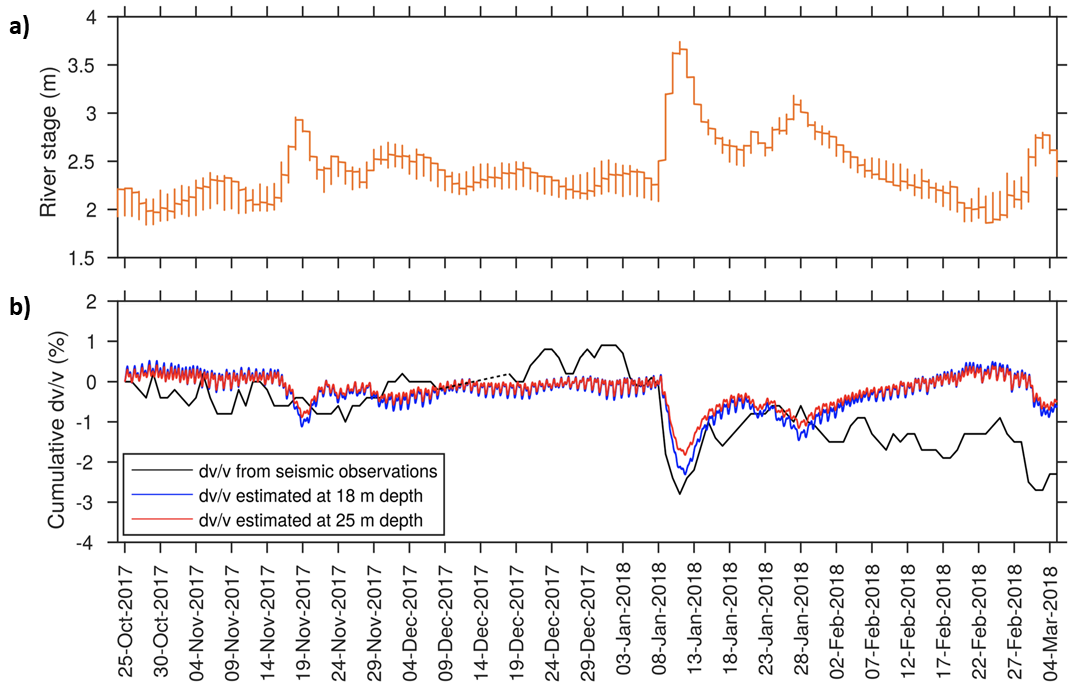
Figure 12 – Relationship between a) Sacramento River stage; and, b) local seismic velocity changes at depth estimated from DAS inversion. Rapid rises (due to flooding) correspond to a decrease in seismic velocity as pore pressures increase, while gradual river stage decline (as seen in February 2018) corresponds to aquifer compression and an increase in seismic velocity. From Tribaldos and others (2021) with permission.
Other applications of DAS include monitoring the stability of flood embankments, in particular for slope-stability pore-pressure inference and detection of backward piping erosion (Aguilar-López et al., 2019). For the slope-stability pore-pressure application, the main physical hypothesis proposed was that the variable soil moisture content of the embankment will have a direct effect on the acoustic properties of the nearby soil matrix in contact with the cable. By deploying one single cable in multiple rows (Figure 13) over the embankment, different signals could be captured at different elevations over the embankment which could later be related to the spatially distributed moisture content.
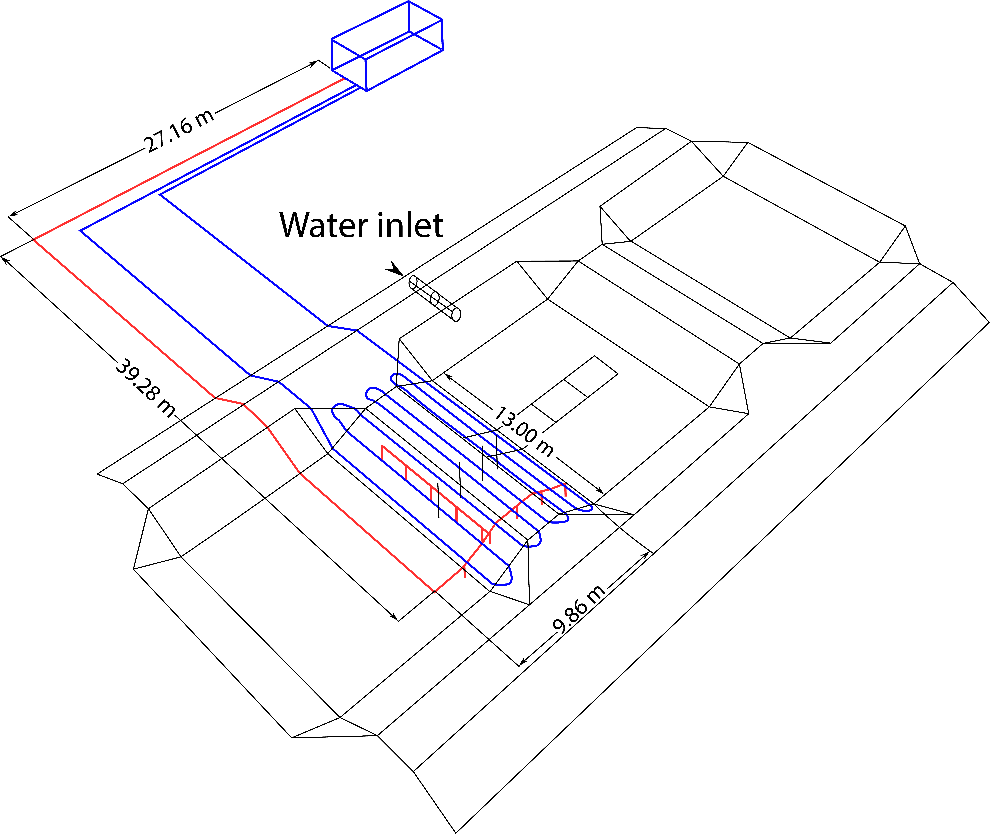
Figure 13 – Oblique and plan view of the geometry of buried fibers (denoted by red and blue lines) within the embankment. Modified from Aguilar-López and others (2019).
The embankment was tested by using three different acoustic energy sources: 1) environment natural vibrations (passive), 2) a sledgehammer (active), and 3) a controlled seismic source with sweeps between 5 Hz and 500 Hz. In the meantime, the embankment’s inner seepage phreatic line was varied over one day. Three-minute-long measurements were taken every half hour at a frequency of 2 kHz. For validation of the measurements, 42 traditional seismic monitoring geophones and five monitoring wells were also installed as validation for the acoustics and seepage-line elevation estimated from the DAS measurements. The results show that total specific storage inside the embankment and surface wave speed are correlated on average as shown in Figure 14.
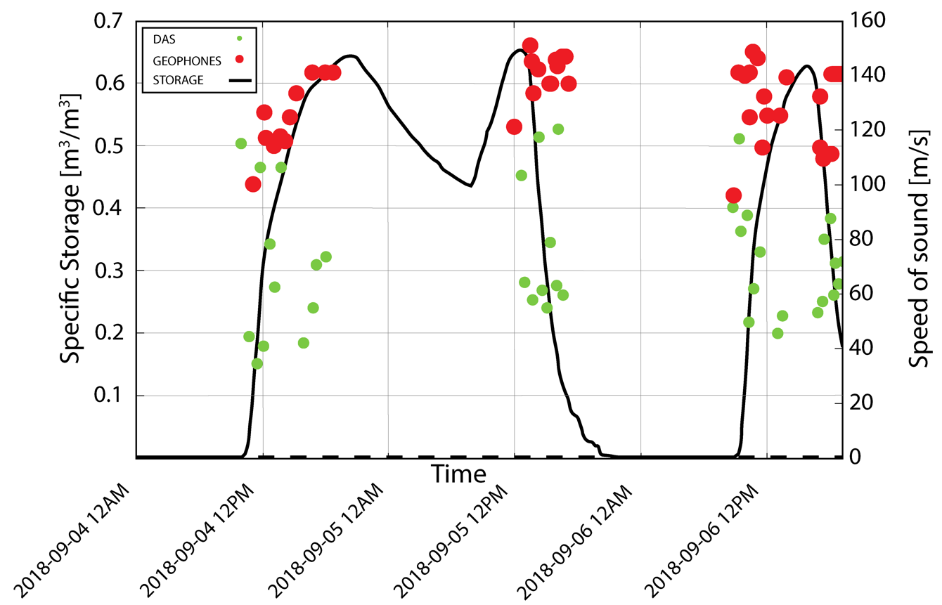
Figure 14 – Correlation between observed seismic velocity (S-wave) and estimated embankment storage. From Aguilar-López and others (2019).