Solution Exercise 3
In the table below, we have taken (by eye) 6 pairs of stage and % change in seismic velocity from Figure 12. You may chose different times, but try to pick enough times that you span the range of river stage and % change in seismic velocity. The data are presented in the table and plotted in the graph below. Note that we have “estimated” the stage to a precision of 0.1 m and the velocity change to a precition of ~0.25 from the figure. Using these data below, a least squares regression equation can be fit (using Excel or by hand) to the data to relate % velocity change to river stage. Using the points below, the regression equation is approsimated below and suggests a fairly robust relation between changes in seismic velocity and the proxy (river stage) for depth to groundwater.
dv/V(%) = −2.2 * stage + 5.5, R2= 0.9
Reported river stage and corresponding normalized change in seismic velocity
| Date | Stage (m) | dv/V (%) |
| 10/25/17 | 2.3 | 0 |
| 11/19/17 | 3.0 | −1 |
| 12/04/17 | 2.6 | 0 |
| 01/10/18 | 3.6 | −2.75 |
| 01/28/18 | 3.1 | −1 |
| 02/22/18 | 2.6 | 0 |
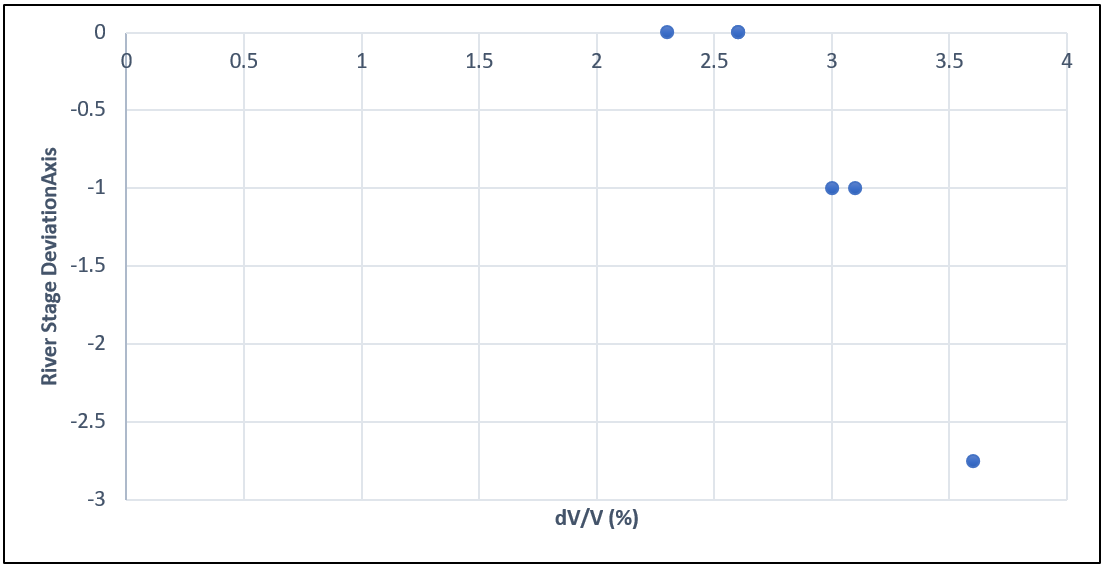
Observed change in normalized seismic velocity related to river stage fluctuations.