3.1 Saturated Zone Properties and Processes
The vertical profile of hydraulic properties can have a profound effect on the hydrology of peatlands. Bogs and fens shed water efficiently to adjacent ecosystems because of a water table depth—transmissivity feedback mechanism (Waddington et al., 2015). Transmissivity (L2 T–1), the product of the hydraulic conductivity and thickness of the flow layer considered, increases exponentially as the water table rises into the near surface layers where hydraulic conductivity is orders of magnitude higher (McCarter and Price, 2017a).
Conversely, when the water table is deep, the transmissivity is low; under such conditions, the saturated layer is thinner and occupies only the deeper, more decomposed peat layers where the hydraulic conductivity can be much lower. Exceptions may occur where macropores or more fibric layers allow preferential flow at depth. Extremely high transmissivities during periods of high water table enable many bogs to shed water by groundwater flow alone, without flow self-organizing into rivulets or streams. Although the effect of this mechanism can be dampened in the presence of preferential flow paths; this mechanism, governed by the pore-scale structures, can control water flow at the peatland scale (McCarter et al., 2020).
Peat is generally considered to be a dual porosity medium (Table 1). It includes relatively large pores between particles such as the leaves and branches of vegetative matter, as well as relatively small pores associated with more decomposed fragments and closed and dead-end spaces within the remains of plant cellular material (Figure 10).
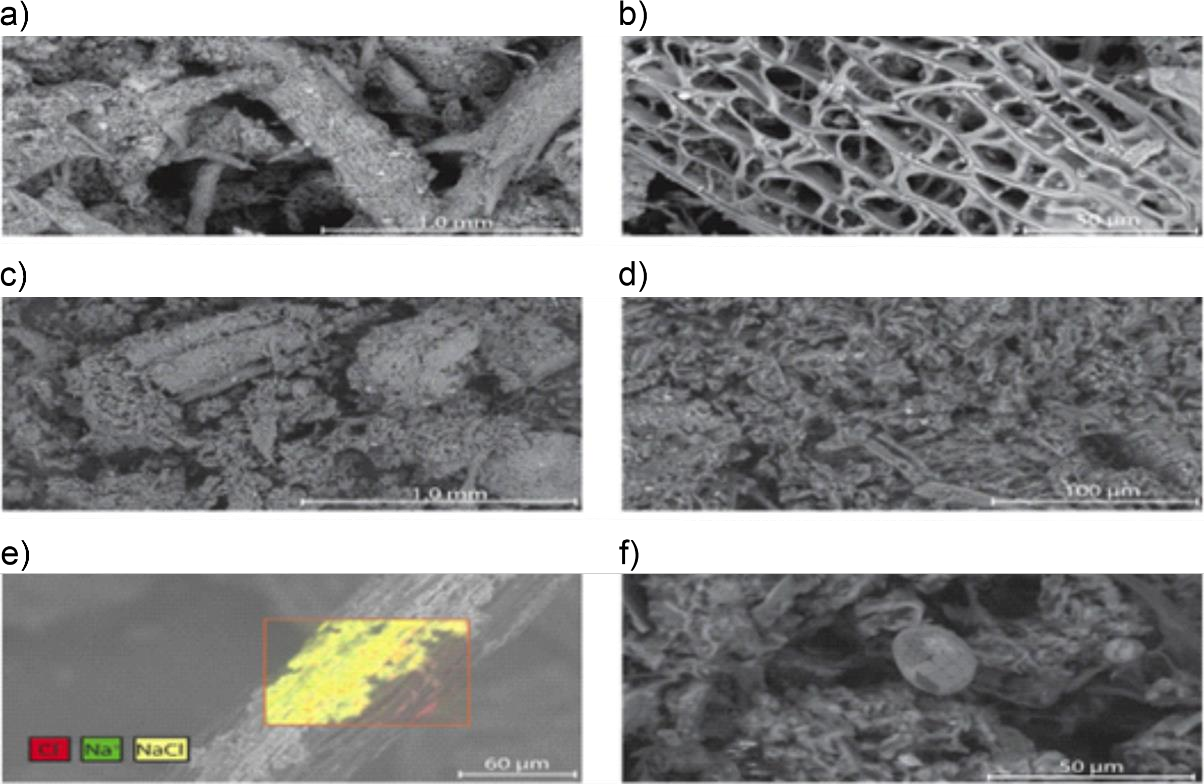 Figure 10 – Scanning Electron Microscope (SEM) images of different peat (Photograph modified from McCarter et al., 2020).
a) Undecomposed Sphagnum peat where the leaf and branch pore structure create an abundance of large pores.
b) Desiccated hyaline cells that comprise the majority of the immobile porosity of undecomposed Sphagnum — here, the cell walls are mostly absent, possibly degraded by sample desiccation for SEM analysis.
c) Decomposed Sphagnum peat (~30 cm bgs), with a greater proportion of smaller pores than undecomposed Sphagnum peat.
d) A magnification of the decomposed Sphagnum peat, highlighting the reduction in large pores.
e) Adsorbed Cl–, Na+, and precipitated NaCl on peat. Conditions in the SEM preclude any liquid water in the sample. The individual red and green spots suggest adsorption of the individual ions. The NaCl likely combines both adsorbed Na+ and precipitated NaCl during imaging.
f) A testate amoeba within peat, highlighting size exclusion from the smaller pores. Samples were completely desiccated during the imaging process.
In some places, the peat has larger preferential flow paths caused by roots, expansion and contraction, and porosity caused by gas emission. These can produce localized areas of high permeability at depth where the permeabilities are otherwise very low. These and other larger pores can transmit water, while the liquid within smaller pores of saturated peat is mostly immobile. Thus, the total porosity (𝜙t) of peat is the sum of the mobile porosity (𝜙mob), and immobile porosity (𝜙im) as shown in Figure 11. This dual porosity strongly affects the flow and storage of water and solutes. Porosity is a unitless quantity, being volume of water divided by volume of sample.
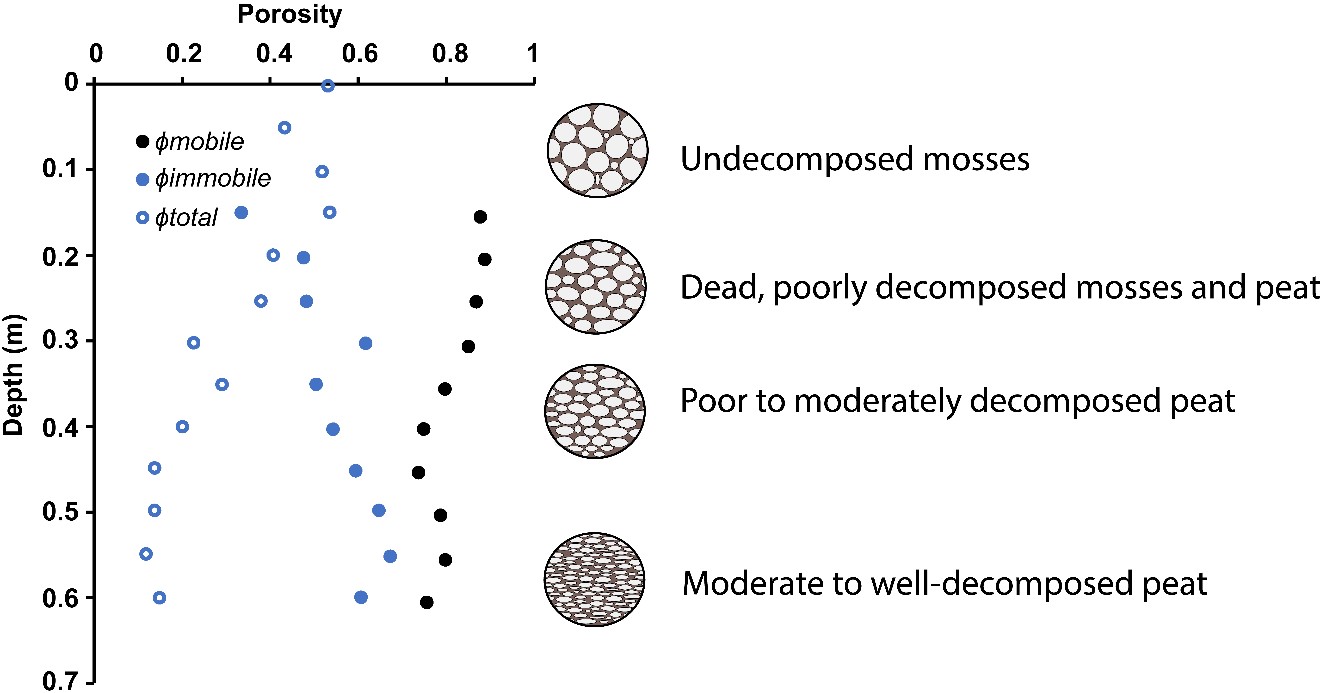
Figure 11 – Change in mobile water porosity (𝜙mob), immobile water porosity (𝜙im), and total porosity (𝜙t) with depth below surface in a Sphagnum-dominated blanket bog peat (Modified from Hoag and Price, 1997). The graphics representing the state of peat decomposition are further described in Figure 8.
Poorly decomposed peat has a high proportion of mobile porosity (upper layer in Figure 11; Table 1), and flow occurs relatively easily (mobile water). Decomposition of peat reduces the fraction of larger pores, so in many peatlands 𝜙mob decreases with depth, while 𝜙im increases (Figure 11). The predominance of larger pores near the ground surface is responsible for the high saturated hydraulic conductivity in that part of the peat profile.
Deeper in the profile, the water table can rise rapidly in response to precipitation input (Figure 12) because much of the peat remains undrained, even at strong suctions. The proportion of porewater that can be drained gravitationally (𝜙d) is < 0.05 at depth (Figure 13). As such, even during dry conditions, the highly conductive peat near the ground surface can be quickly re-activated into the runoff process. Water tables near the surface, where drainable porosity is high, exhibit a damped response (i.e., near-surface peat, with high drainable porosity, can gain or lose relatively large volumes of water for a given water table change).
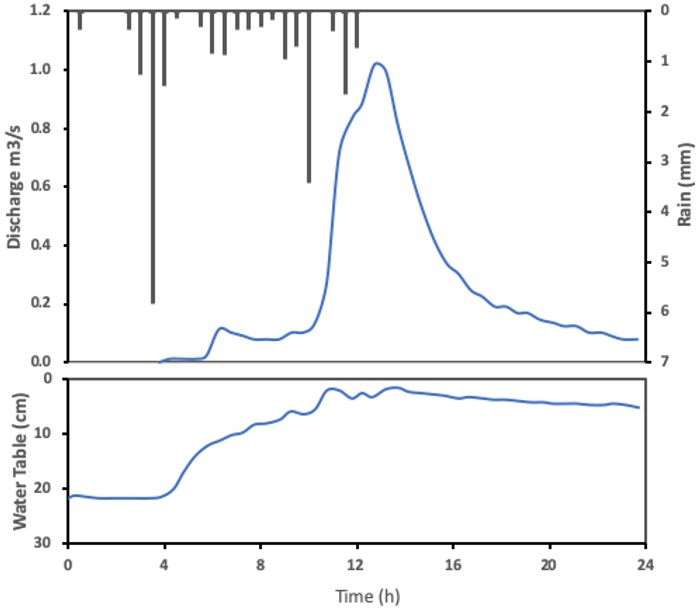
Figure 12 – Rainfall (bars) runoff response (upper diagram) and water table (lower diagram). Initially, there was no runoff while the water table was low. The largest rain event generated no runoff but caused the water table to rise — quickly at first (where drainable porosity is low), then less quickly nearer the surface (where drainable porosity is higher). At this location (Trout Beck, Cumbria, United Kingdom; 6 July, 1995), runoff was not initiated until the water table was within 10 cm of the surface, because of the large increase in peat transmissivity (Redrawn from Holden, 2006).
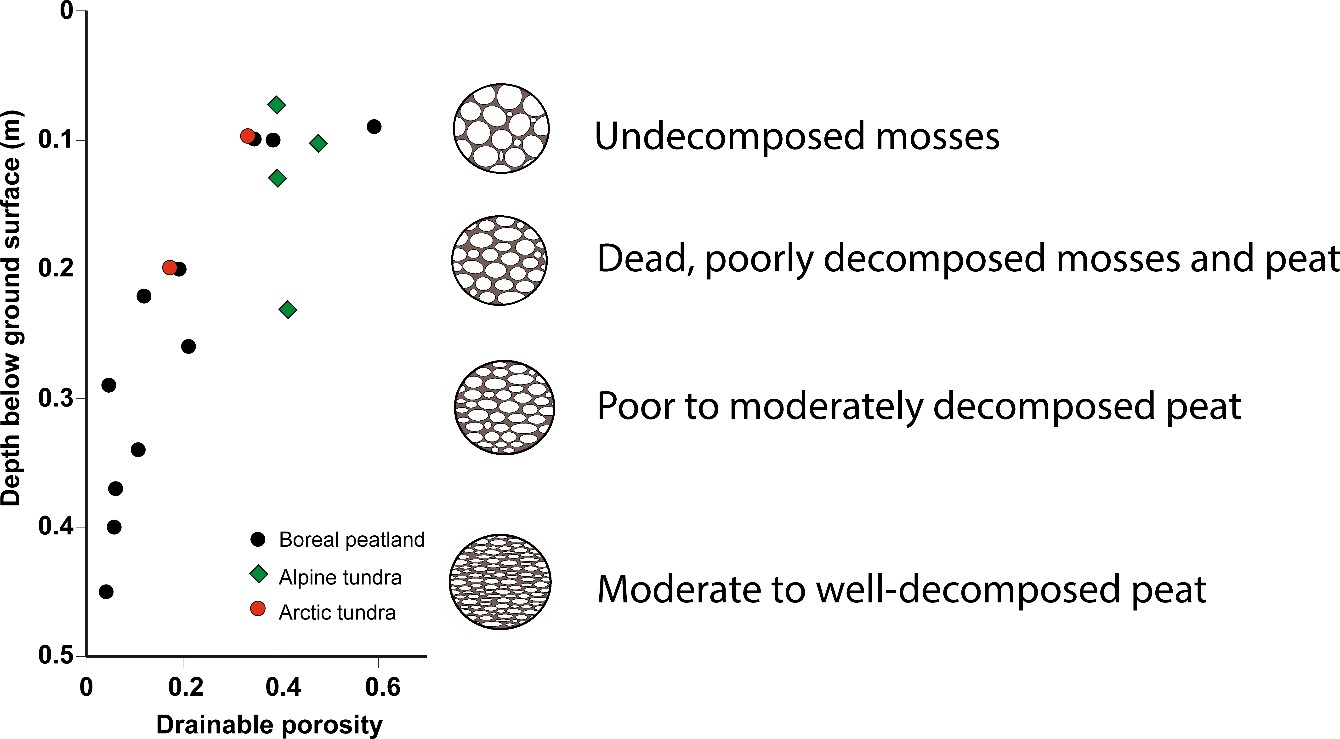
Figure 13 – Variation of drainable porosity (𝜙d) with depth below the ground surface based on measurements made on discrete peat samples representing a range of depths (modified from Quinton et al., 2008). Peat accumulations are typically less than 30 cm at the two tundra sites presented here. For this reason, the number of observations presented for these sites are relatively few. By contrast, peat accumulations typically exceed 2 m at the boreal peatland site, although data are presented only for the upper 50 cm.
The water storage relations of some peatlands are confounded by the high compressibility of peat, which adjusts its volume depending on changes in water pressure based on water table position. This results in a process named mire breathing, in which the ground surface rises and falls with changes in water table depth. Sometimes this is referred to as peat-surface-oscillation (Fritz et al., 2008). This process is driven by changes in effective stress, σe (Equation 1), which is the load due to the weight of peat and water expressed as total stress, σT (Equation 2), above a given point in the peat profile offset by the buoyancy caused by the height of the column of water above that point, namely the water pressure (ψ).

Thus, effective stress is highly sensitive to changes in water table elevation, such that the surface elevation can decline many centimeters in one day (Roulet, 1991; Whittington and Price, 2006). Given the high compressibility of peat compared to mineral matrixes, water table fluctuations result in volume changes. The implications of this can be important hydrologically, ecologically, and biogeochemically, since a drop in the water table elevation induces a drop in the ground surface elevation, so the depth to the water table below the ground is less than it would otherwise be. Hydrologically, this means saturated water flow can be sustained in the upper layer of the peat deposit, and that the nature of water storage relations is affected as discussed in the next paragraph. Having a relatively high and consistent water table affects the plant community type as well as the decomposition processes, thus the carbon exchanges.
Peatlands most susceptible to mire breathing tend to be those containing poorly decomposed peat with high water content. Mire breathing is exacerbated by large water table elevation changes. While the relationship of the water table elevation to water storage in unconfined aquifers is usually governed by specific yield (Sy) as discussed in Section 8.3, water storage changes associated with changes in aquifer volume can be important in peat. This is akin to the specific storage parameter (Ss) that is significant for confined aquifers and negligible for unconfined aquifers. For example, Price and Schlotzhauer (1999) showed that for a 1.8 m cutover peat deposit (cutover means that some of the peat mass has been harvested), an ~50 cm decline of the water table elevation caused the surface elevation to decline about 10 cm. The water storage change due to compression in the saturated portion of the peat deposit was greater than would be associated with water table lowering alone (i.e., pore water drainage volume calculated as the product of water level change and specific yield). In that system, the storage change (ΔS) needs to be calculated using Equation 3 which requires both Sy and S.

Estimating the water budget using only Sy (~0.05) without bSs (~0.08) resulted in an error of more than 100%. At the same site, Price (2003) recorded a two-order of magnitude decrease in hydraulic conductivity 0.75 m below the surface as a consequence of seasonal subsidence. The hydraulic conductivity in a nearby undisturbed site, where water table fluctuations were much smaller, was reduced by about 50 percent.
A widely used parameter to quantify the hydraulic character of saturated peat is the hydraulic conductivity (Ksat). The hydraulic conductivity of saturated peat is related to the size and connectivity of pores, such that it increases proportionately with the square of the mean pore throat diameter; it is also affected by pore volume, distribution, and shape; all of which are dependent on the degree of decomposition and compaction. Ksat of a peat matrix is related to the hydraulic radius of pores (cross-sectional area/perimeter). Thus, with increased depth (hence, typically increased decomposition) the median hydraulic radius decreases as a result of the reduction in pore throat diameters, and perhaps also as a result of the flattening (due to compression) of pore shapes. Both of these changes increase hydraulic resistance, so tend to reduce hydraulic conductivity with depth.
While the distinct decrease in Ksat with depth has been reported by many researchers, others have reported higher than expected values at depth, possibly due to macropores associated with woody inclusions (Chason and Siegel, 1986) or layers of less decomposed peat that probably reflect periods of wetter/cooler climate during development. A wide range of techniques have been used to measure Ksat in the field — including the use of tracers and water level recovery tests — and in the laboratory — including the use of permeameters and image analyses of samples as discussed in Section 8, Methods and Approaches. The larger scale approaches to estimating Ksat, such as aquifer tests, can produce higher estimates because they are more likely to include macropores (Glaser et al., 2021).
Although absolute values of Ksat can vary widely for different peat types, hydrogeomorphic settings, and even within a single peatland, typical profiles of Ksat demonstrate common profile characteristics including the presence of a relatively thin (~0.1 m) top layer of living vegetation and lightly decomposed peat where average Ksat values are high (e.g., 10 – 1000 m d-1) such as shown in Figure 14. Below this is a thicker peat layer in a more advanced state of decomposition where Ksat values and variability are typically lower (~0.5 – 5 m d-1). Between these two layers can lie a transition zone where the rate of reduction in Ksat with increasing depth is large (Figure 14). While high Ksat of acrotelm peat is critical to the connectivity between adjacent peatlands or to the adjacent aquatic system, the typically lower Ksat of catotelm peat can modulate the water and solute exchanges between deeper groundwater and the peatland, although this is more likely to be controlled by low permeability underlying mineral sediments (Reeve et al., 2000).
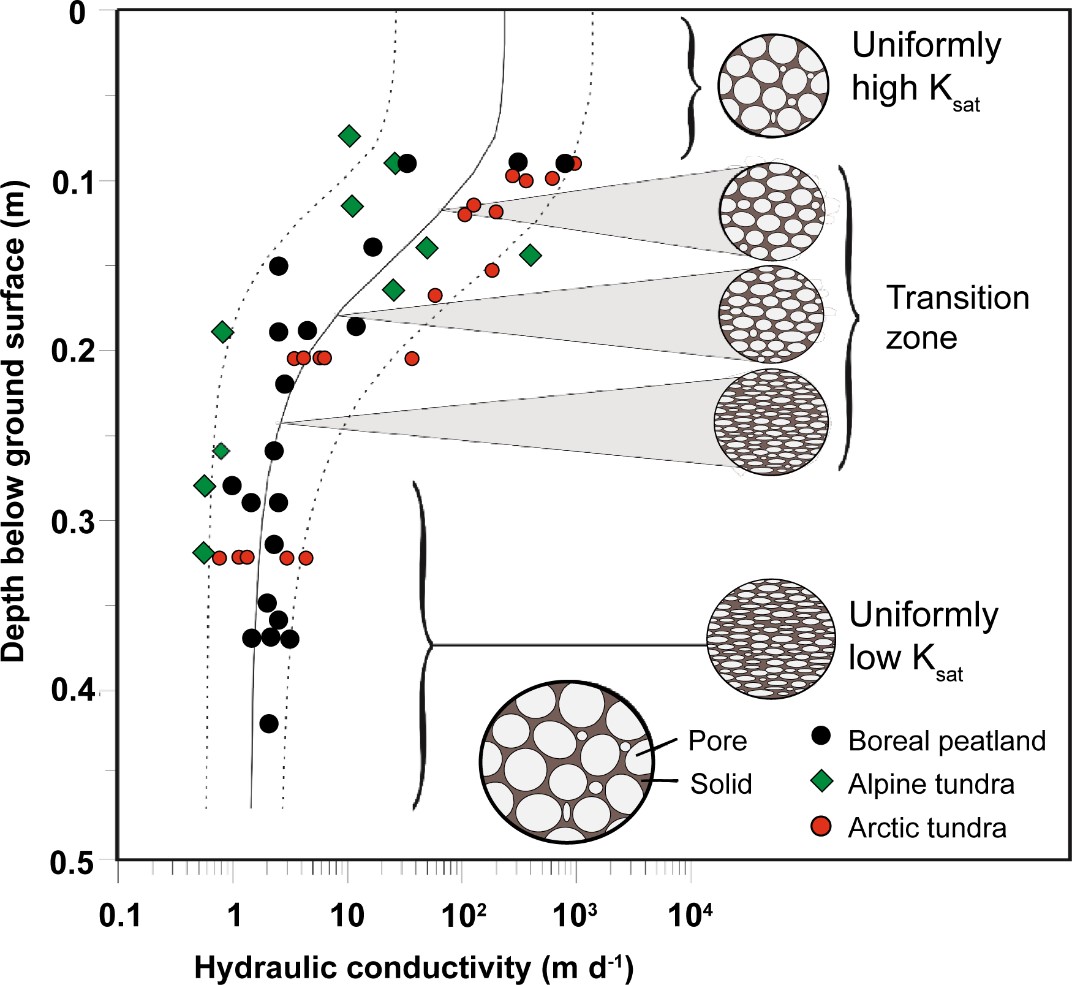
Figure 14 – Saturated hydraulic conductivity of peat overlying permafrost from boreal peatlands (Quinton et al., 2008), alpine tundra (Quinton et al., 2004), and arctic tundra (Quinton et al., 2000). The solid line indicates the best-fit of Ksat versus depth as determined by the least-squares method; the dashed lines indicate upper and lower envelopes of data points for the boreal peatland. Tundra values of Ksat occupy a similar range. The reduction in Ksat with increasing depth is largely accounted for by the decrease in the average pore diameter and pore hydraulic radius with depth (Modified from Quinton et al., 2008).
Peat hydraulic conductivity in a given setting can be temporarily reduced by peat consolidation caused by seasonal water table lowering (Price, 2003); it can also be underestimated due to a reduction in pore water pressure that causes peat structure to collapse during a bail test used to estimate hydraulic conductivity. Furthermore, Beckwith and Baird (2001) showed that biogenic gases, specifically methane, released from moderately to well decomposed peat can reduce the apparent hydraulic conductivity by blocking pores, although Glaser and others (2021) suggest it may cause pore dilation. This effect is less important in the upper layers of peat where the pore structure is larger (Kettridge et al., 2013). Rosenberry and others (2006) found gas volumes in peat from 2 to 20 percent, the pressure from which can influence hydraulic gradients (Kellner et al., 2004) such that increases in pressure at depth can cause flow reversals, or even an outward radial flow (Waddington and Roulet, 1997).
Finally, hydraulic conductivity is affected by water viscosity and there are strong temperature gradients in the near surface groundwater in peatlands that are large enough to cause substantial differences in viscosity, so care must be taken when comparing, or using, such values. More details on evaluating hydraulic conductivity are provided in Section 8.3, Hydraulic Conductivity.