3.2 Unsaturated Zone Properties and Processes
In the acrotelm, the rapid change in pore size and shape with depth enables important ecohydrological feedbacks that sustain critical biological processes and peat accumulation. Such feedback depends on the relationship between soil water retention and unsaturated hydraulic conductivity (Kunsat) within the peat, a relationship governed by the pore structures discussed above and statistically related to bulk density (Livett and Lennartz, 2019). As peat bulk density increases, so too does the ability of the peat to retain water. Higher water retention capacity increases the value of Kunsat at the same soil water pressure and, therefore, the ability of peat to conduct water. Rezanezhad and others (2010) found that for a soil water pressure of ψ = -40 cm, the large pores and much of the continuously connected water phase of the initially saturated Sphagnum peat samples had drained, and as a result could no longer conduct sufficient water to avoid ecohydrological stress.
Computed Tomography (CT), an imaging technique used in the medical field to generate a detailed picture of internal structures, provides insight into the water pathways in peat. It revealed that in addition to drainage of larger pores, smaller pores also drained, leaving a more irregular shape and smaller hydraulic radius of the remaining connected water pathways. This reduced the value of Kunsat and therefore constrained water movement. A visualization of air-filled pores and their diminishing size with depth is shown in Figure 15.
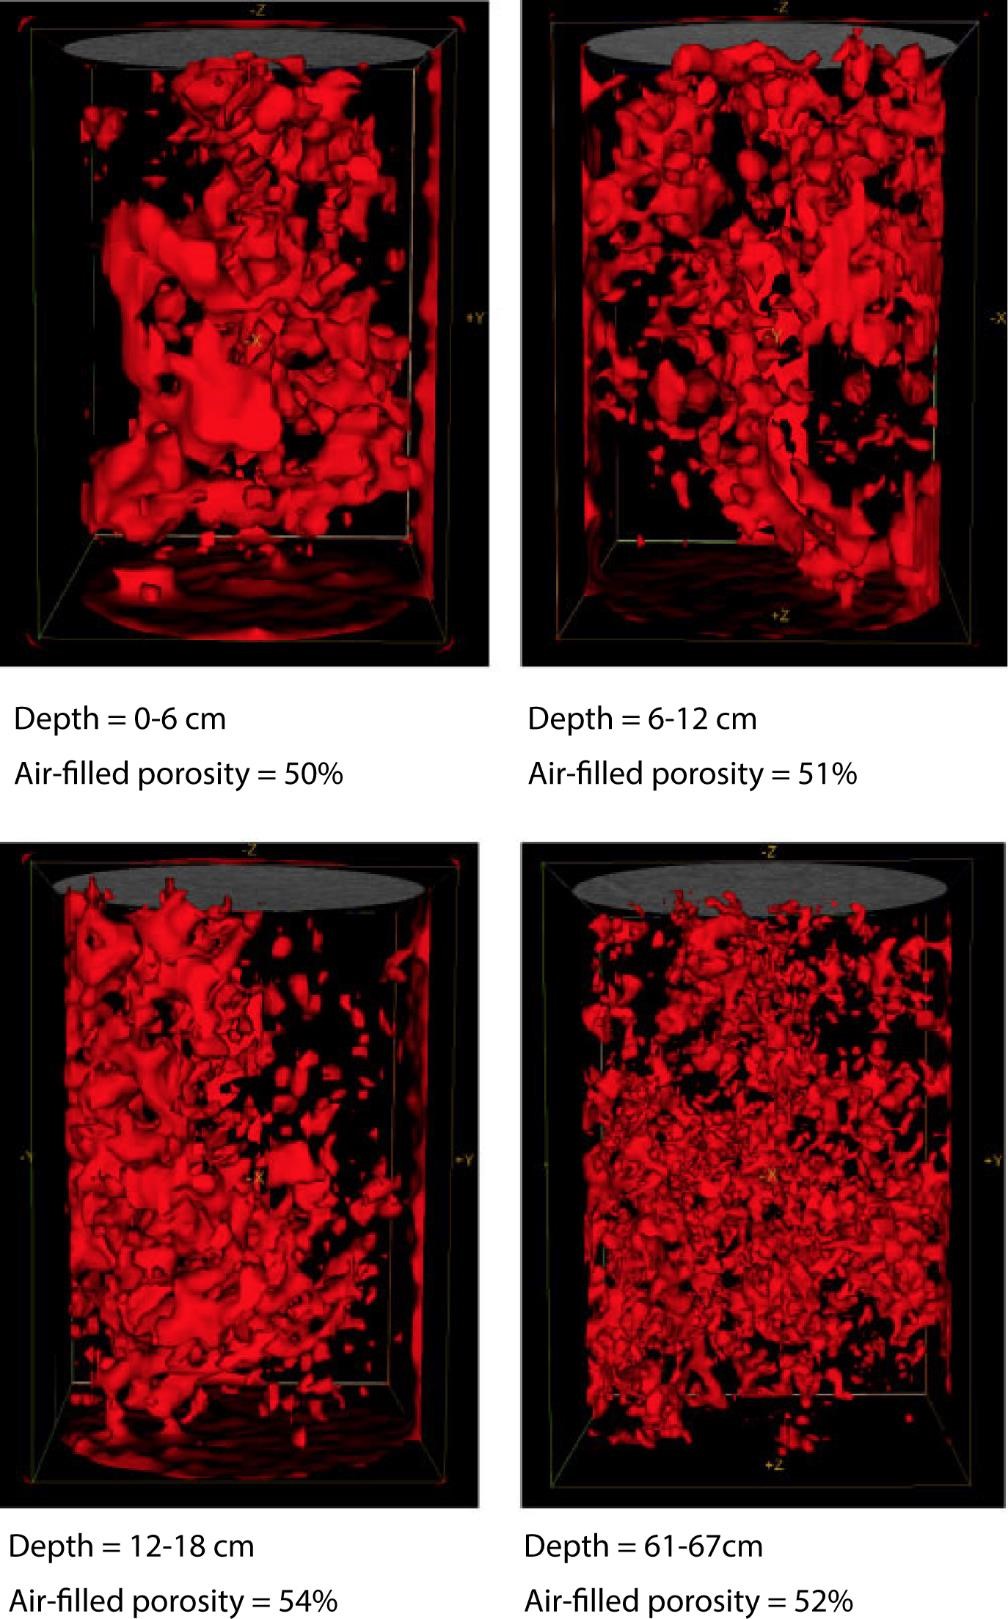
Figure 15 – Visualization of air-filled porosity (in red) of peat samples at increasing depth, all at ψ = -40 cm. In each 6-cm diameter core the total number of air-filled pores increased with depth from 7,956 to 13,267 to 15,041 and finally to 39,812 (Modified from Rezanezhad et al., 2010).
The three-dimensional images of Rezanezhad and others (2010) were used by Gharedaghloo and others (2018) to develop a pore network model that simulated the movement of water through individual pores and pore networks. These simulations showed that while hydraulic conductivity is isotropic (i.e., independent of the direction of measurement) at small scales, it becomes anisotropic (i.e., dependent on the direction of measurement) at larger scales due to the strong heterogeneity resulting from the layered structure of peat. This favors horizontal transport in the upper layers as discussed in Section 4.1, Transport in Peat.
At the near surface where Sphagnum peat is characterized by low bulk densities and high hydraulic conductivity, soil water content can decrease by 30 to 60 percent with a decrease of just 5 cm soil water pressure (Figure 16a). This dramatic decline in soil water content decreases Kunsat by at least an order of magnitude (Figure 16b), creating highly nonlinear soil water pressure—unsaturated hydraulic conductivity relationships. This creates conditions that decrease capillary rise of water to the surface of the moss, thus limiting evaporation. In peat with higher bulk densities, such as sedge fen peat, the decline in both soil water content and Kunsat is not as severe because water is preferentially retained in the smaller pores. Consequently, evaporation from peats of higher bulk density is rarely limited by capillary processes, and it is augmented by transpiration from vascular plants, which pull water upward in the soil profile. For a given negative pressure, peat from lower in the profile has higher water content than that from shallower layers because the smaller pores at depth remain continuously connected (Figure 16a). At saturation (i.e., greater than or equal to zero pressure) the shallow zone has the highest hydraulic conductivity (Figure 16b) because of its large pores. However, with a small decrease in pressure the largest pores drain, reducing pore connectivity thus hydraulic conductivity. Consequently, more decomposed peat at depth that retains water at decreasing pressures sustains a higher level of connectivity, thus hydraulic conductivity.
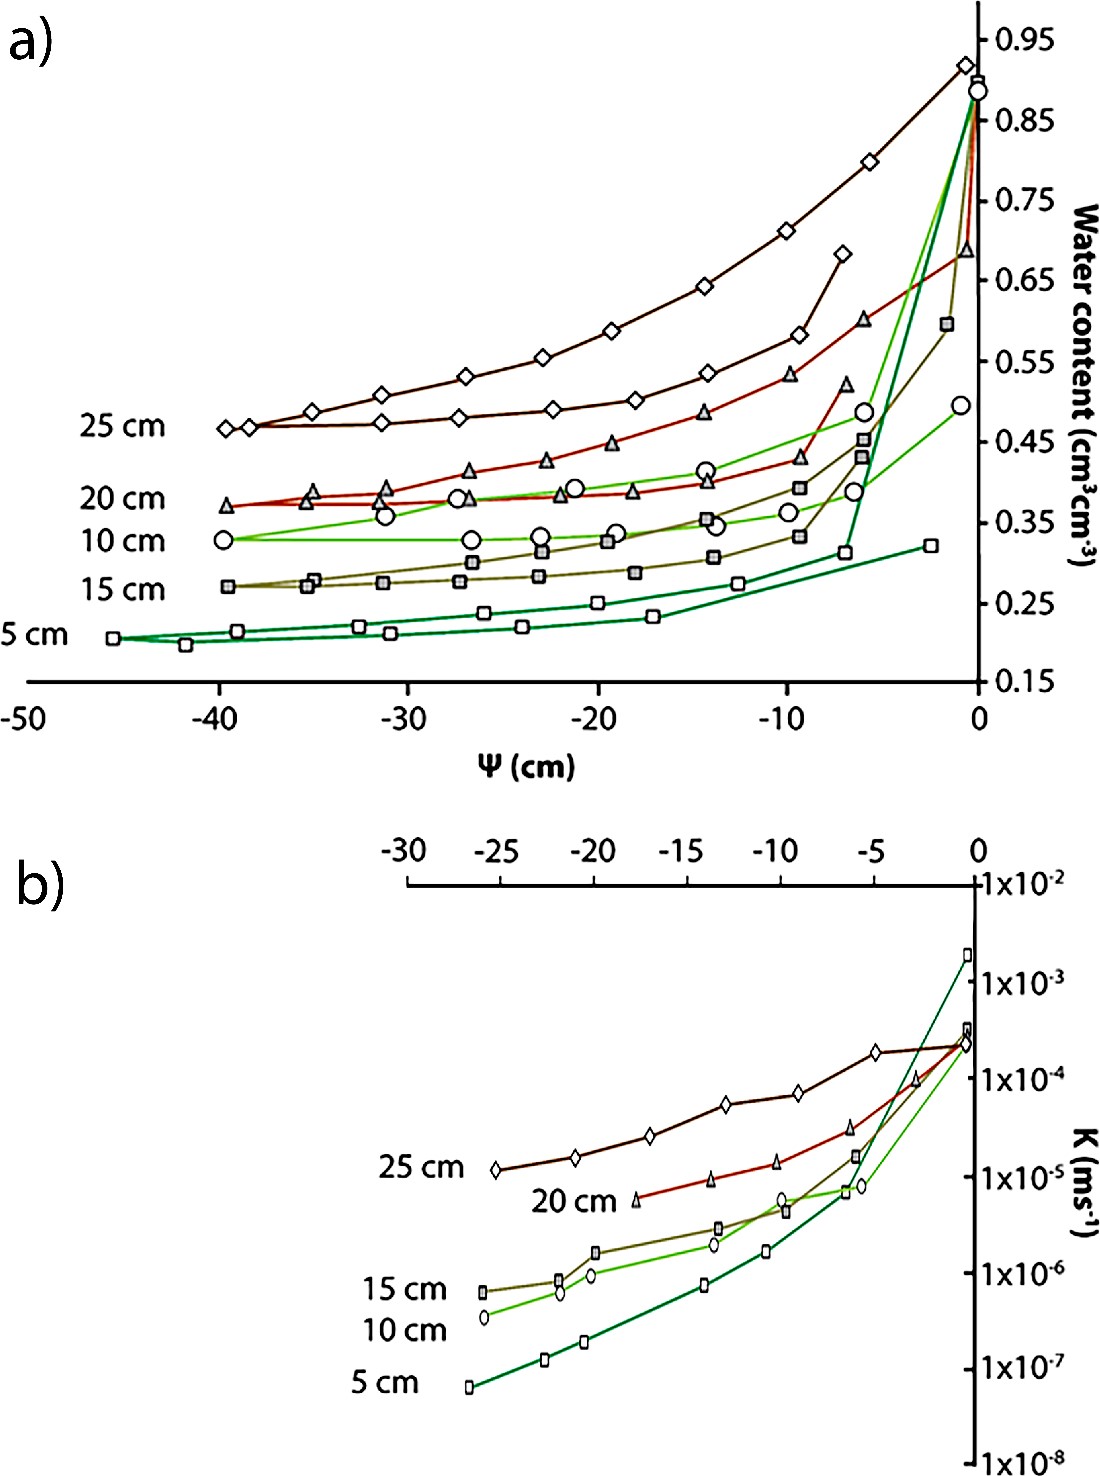
Figure 16 – a) Examples of soil water retention curves for drainage and rewetting of a bog peat. Hysteresis causes the rewetting curve to plot at lower water content for a given pressure. Soil water retention curves commonly have a shoulder in the pressure range near zero, representing sustained water content at slightly negative pressures; water content then declines substantially with further reduction in pressure as the matrix drains. In this example, the method was not able to test in this pressure range, so a shoulder is not visible. For a given negative pressure, deeper zones have higher water content than shallow zones because the pores are smaller thus maintain continuously connected zones of water. b) Hydraulic conductivity as a function of pressure for the same layers of peat. At saturation, i.e., zero pressure, the shallow zone has the highest hydraulic conductivity because of its large pores, but continuous zones of water decrease substantially in large pores following a small decrease in pressure. Consequently, more decomposed peat at depth that retains water at decreasing pressures, sustains a higher level of connectivity, thus hydraulic conductivity. Modified from Price and Whittington, 2010.
Hydraulic conductivity responds to soil freezing in a way similar to how it responds to soil drying since the water held in relatively large pores freezes readily, while that held in small pores (and therefore under greater tension) can remain unfrozen well below 0 °C (Kane and Stein, 1983). The hydraulic conductivity of both drying and freezing soils therefore decreases sharply as the water in large pores drains and/or freezes and the remaining liquid water is forced to flow through small pores and thin films (Watanabe and Flury, 2008). For this reason, the relationship between soil temperature and liquid water content, called the soil freezing characteristic, is analogous to the soil moisture characteristic of unfrozen soil (Miller, 1980).
The proportion of water in a variably saturated medium like peat can be described with the parameter effective saturation, Se, as defined by Equation 4.


The values of θs and θr can be approximated from soil-water retention curves such as those shown in Figure 16. When simulating flow in peat, gains and losses of water from the matrix must be calculated using the appropriate value of unsaturated hydraulic conductivity given the changing soil-water pressure. The most common method for describing the soil water retention and unsaturated hydraulic conductivity relationships in peat involves fitting the van Genuchten-Mualem (VGM) soil hydraulic property model (van Genuchten, 1980) to measured data. The VGM soil water retention model is defined by Equation 5.


The parameter values of Equation 5 can be estimated by collecting a suite of values for Se, α, and h experimentally in a laboratory. Then n can be determined by curve fitting.
The hydraulic conductivity in the VGM soil hydraulic property model (van Genuchten, 1980) follows the Burdine-Mualem conductance model (Mualem, 1976). Here, the VGM hydraulic conductivity model (van Genuchten, 1980) commonly follows Equation 6 in peat studies, where m is restricted as above.

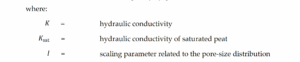
The other parameters are as defined for Equation 5 (Mualem, 1976).
Unlike mineral soils that typically fix l to 0.5, studies in peat have found that fitting l gives better agreement with the measured data. Although more complex models better describe the multi-modal soil water retention and hydraulic conductivity profiles (Weber et al., 2017), for most applications the van Genuchten-Mualem model provides a good representation of the underlying hydrological processes.
Details about the range of the soil retention/unsaturated hydraulic conductivity parameters for peat are provided in Box 4.