3.2 In-well techniques
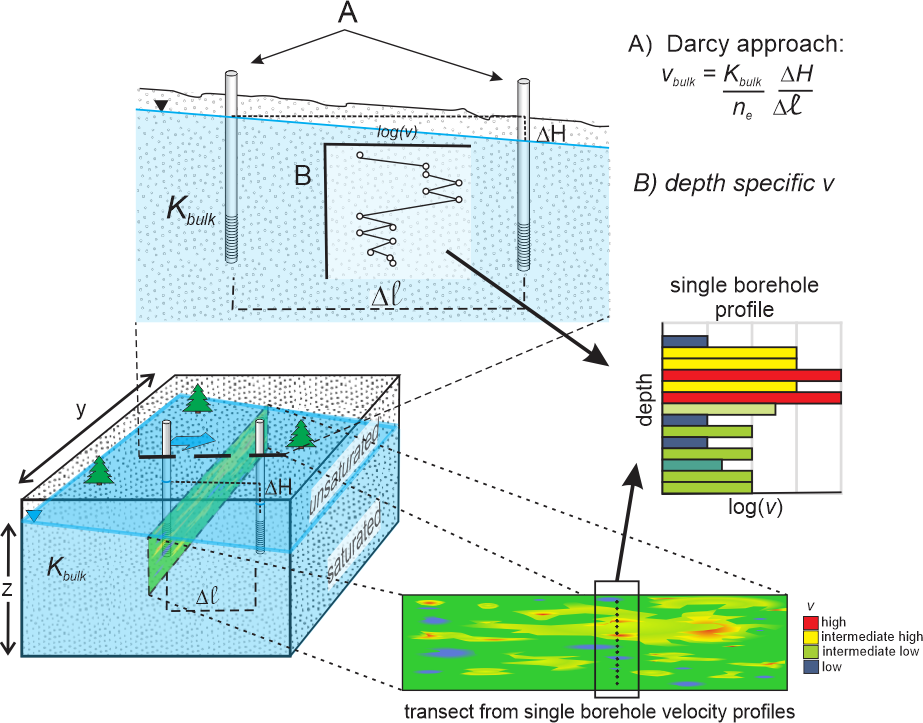
Tests performed in single wells tend to interrogate a spatial scale much less than inter-well tests, which presents both advantages and difficulties. An advantage of single well tests is that they offer the chance of quantifying the complete range of subsurface flow rates in important locations (Figure 8). Moreover, they are faster and less costly to perform than inter-well tracer tests are likely to be. For this reason, they have received attention over the years. However, the smaller spatial scales they sample — which are not always known with high precision — means that in most cases several tests will be necessary in more than one well location to reasonably define or validate a flow system. Fortunately, if a site is already instrumented with multiple wells, this requirement may not add a great deal of cost to a characterization study.
In keeping with the considerations above, the best known of the direct velocity measurement methods are conducted with equipment deployed in wells, a strategy that has the advantage of convenience but the drawback of a strong possibility of measurement biases caused by the wells, the well screens, and the filter packs. Flow distortions arising from these features can to some extent be estimated in advance and considered during the data analysis stage. However, these calculations assume idealized geometries, fully open well screens, and homogeneous filter packs, which are rarely realized in field applications.
The presence of instruments inside a well, which in some cases may restrict flow through the well, can also invalidate calculations and calibrations that do not include them. Vertical flow in a borehole, or density induced flow, which is manifested more strongly in an open well than in a porous medium, can also create disruptions that confound the accurate sensing of groundwater speed and direction from wells.
Point Dilution Methods
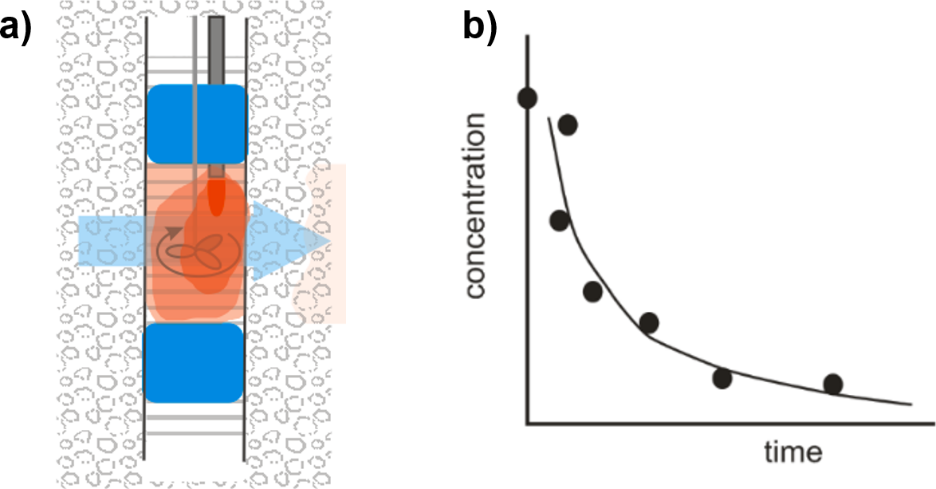
The best known of the in-well groundwater velocity measurement methods is arguably the borehole dilution technique, also known as the point dilution method. A measurement is conducted in a section of a well or borehole that is isolated with packers as shown in Figure 8a, spiked with a tracer, and mixed. The tracer concentration is tracked over time as water flows through the well replacing the tracer solution. The rate of tracer loss is proportional to the ambient groundwater velocity as illustrated in Figure 9 (Drost et al., 1968). A common practice is to use saline tracers (e.g., salts of Cl– or Br–) but the effects of solution density on flow from the well can be problematic. A viable response to this problem is to use radioactive isotopes or fluorescent dyes (if permissible by groundwater oversight agencies), since these substances can be introduced and detected at extremely low concentrations — exerting no practical effect on flow related to solution density.
A variation on the point dilution technique, called the Finite Volume Point Dilution (FVPD) method, involves the continual addition of tracer to the well while water is recirculated to achieve mixing in the well as shown in Figure 10 (Brouyere et al., 2008).
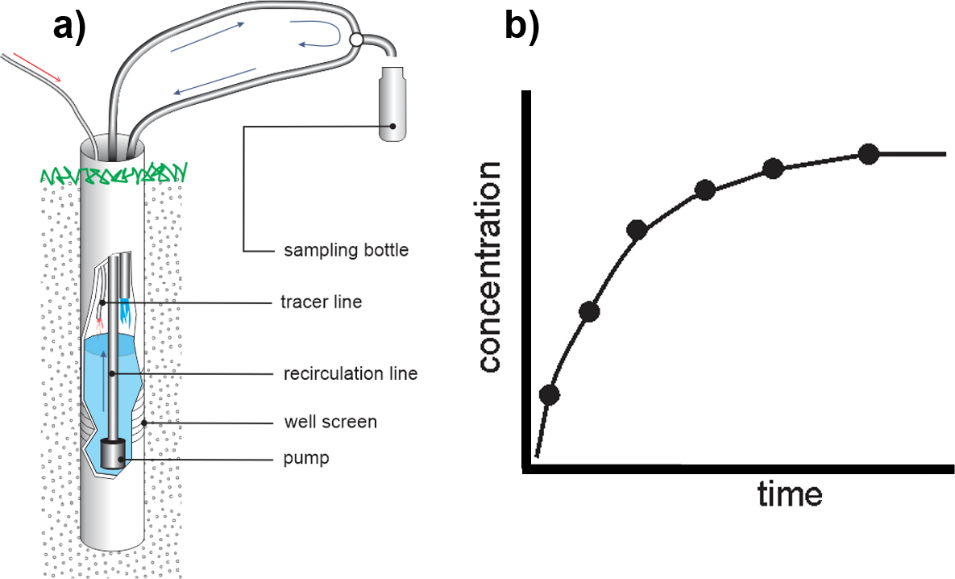
The steady state concentration of tracer that develops in the well is a function of the flow rate entering the well from the aquifer, provided the tracer injection rate is low compared to the groundwater flow rate through the well. If the tracer concentration in the well at the beginning of an FVPD test is zero, then the tracer concentration rises in the well over time to a final plateau value. The flow rate can be calculated from either the rising portion of the curve, the plateau, or both. Similarly, an analysis can be performed to determine groundwater flow rates based on the falling curve of a subsequent well flushing test.
Heat Pulse Flowmeter
A tracer that offers several advantages for groundwater velocity measurements is heat. Heat is easy to introduce to the subsurface and can be detected, through temperature measurements, with great precision and accuracy. Unfortunately, heat also brings with it some serious challenges. For example, the density of a solution is sensitive to its temperature, so measured flow rates can be biased by heating groundwater. In addition, heat transports in both solids (diffusively) and water (advectively and diffusively). The rate of transport in the solids depends on the thermal conductivities of the solids. These coefficients are generally assumed to be uniform and constant in the well and formation, which may introduce errors in some cases. An instrument that uses heat to measure groundwater velocity was introduced in the mid-1980s and is commonly referred to as the Heat Pulse Flowmeter (HPF), or Geoflometer® (Kerfoot and Massard, 1985). The device works by heating water in the center of the device, typically deployed in the screened portion of a well, and then allowing flow to carry the warmed water past an encircling array of thermistors. The rate that groundwater moves through the system is calculated from the arrival time of the tracer at the detectors, and the flow direction is determined on the basis of which detectors respond (Figure 11).
The HPF was an early technology for direct measurement of velocity at small scales (~10 cm) and this may, in part, account for a mixed record of success. Practitioners accustomed to flow systems defined by water level surveys might understandably question the validity of a method that detects high levels of variability that are invisible to the Darcy approach of estimating velocity. Indeed, instrument limitations may have been the source of some of these errors. For example, flow directions have been sometimes found to be self-contradictory (i.e., thermistor responses both upstream and downstream simultaneously in the same well) with these probes, for reasons that are not understood.
In Well Point Velocity Probe
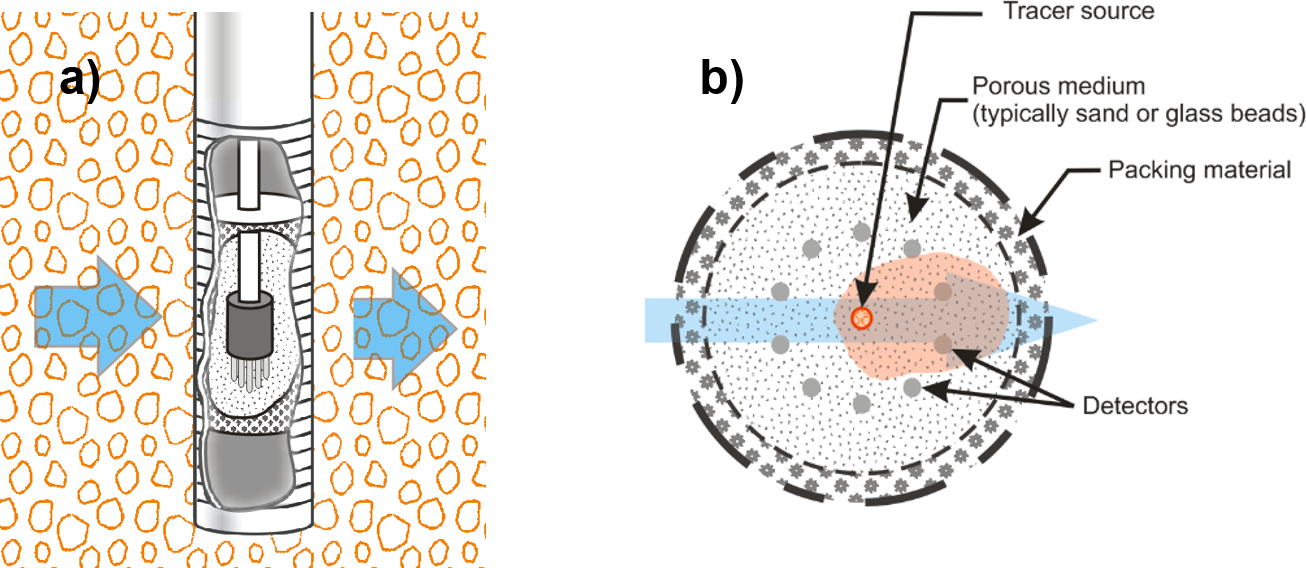
Another device that functions by tracking a tracer released in the center of a flow-through probe is the In Well Point Velocity Probe (IWPVP) as shown in Figure 12a (Osorno et al., 2018).
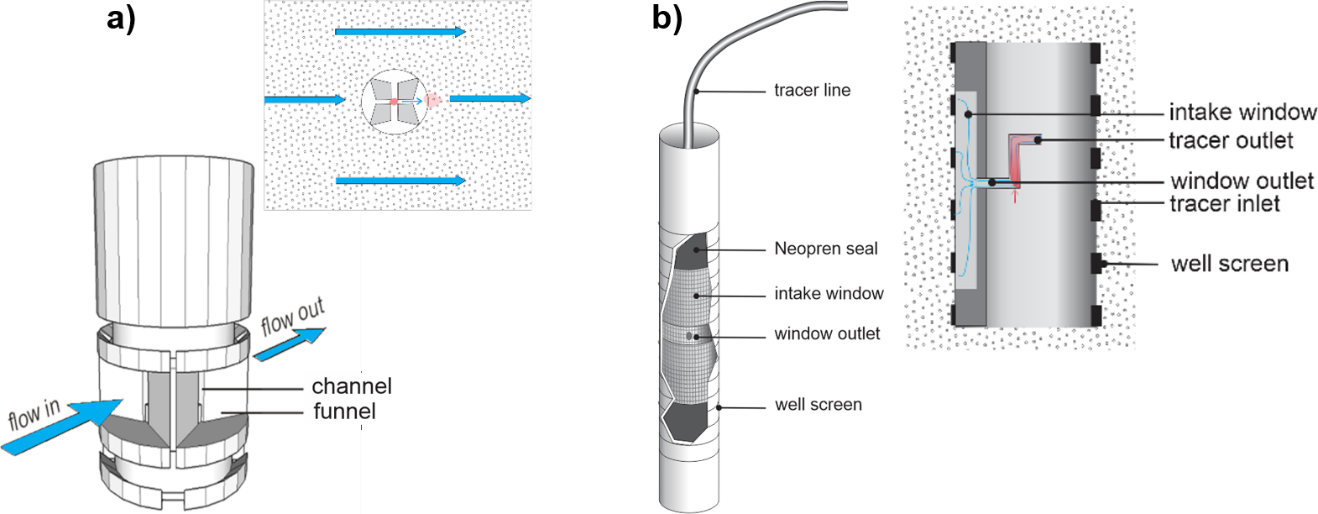
This instrument differs from the HPF by restricting the flow path out of the probe to four channels with detectors. This restriction simplifies data interpretation by reducing the number of detection signals that must be analyzed. The device makes single measurements of velocity at the centimeter scale but can be repositioned in a well-screen to obtain profiles of velocity with depth. It can also be fabricated in a multilevel fashion that can reduce the number of times repositioning is necessary to obtain velocity profiles. The device currently relies on tracers detected with electrical conductivity detectors, but the design could also support heat or other tracers.
Direct Velocity Tool
The Direct Velocity Tool (DVT) also operates on the principle of capturing groundwater with a well, directing it through an instrument where a tracer is added and then detected as it leaves the device as shown in Figure 12b (Essouayed et al., 2019). The DVT also uses saline tracers, which it detects with electrical conductivity sensors. However, the design differs from the IWPVP in two major ways: first, water is collected from a single, fixed portion of the well screen — requiring advanced knowledge of the flow direction, or repositioning of the device in the well to find the flow direction — and second, the tracer is added continuously to the groundwater stream during testing; the IWPVP introduces the tracer as a low volume pulse. The DVT estimates velocity from the degree of tracer dilution in the groundwater stream rather than timing the arrival of a tracer pulse.
Passive Flux Meter
Other in-well devices for measuring groundwater velocity include the Passive Flux Meter (PFM), which measures water or solute fluxes by quantifying the elution (i.e., dissolution and transport out of the instrument) or collection of tracers and contaminants on sorptive materials placed in a well (Hatfield et al., 2004). The PFM method returns Darcy flux values rather than seepage velocities, making it complimentary to other direct velocity measurement methods. The PFM has been adapted for various hydrologic settings, including fractured rock wells, hyporheic zone settings, and groundwater-surface water interfaces.
Colloidal borescope
The colloidal borescope is a down-well instrument that comprises a light source and a camera mounted about 0.25 m apart. The light illuminates colloidal solids suspended in groundwater passing through the well, and the camera records the movement. Software tracks the individual colloidal particles and the statistical distribution of colloid velocities in the well is then determined (Kearl and Roemer, 1998). The predominant colloid velocity is taken as indicative of the seepage velocity outside the well through correction factors. In principle, the instrument is useful for velocities in the low centimeters per day range to several meters per day. However, in some cases, particularly those involving low flow environments, the colloid movement in the well has been observed not to settle on a clear, predominant, velocity. Therefore, the technology may gain effectiveness as seepage velocities tend to the higher values characteristic of groundwater.