8.3 Solutions Pertinent to Exercises Related to Section 3
Solution Exercise 11
Depending on circumstances and available data, there may be various options to test the plausibility of the reported values. First by comparing the recharge estimates with climatic data (rainfall and rainfall minus evapotranspiration). It is convenient to convert the volumetric recharge estimate (m3/year) into an equivalent depth of water per unit area estimate (mm/year). The ratio of mean recharge over mean precipitation – both expressed in mm/year – should not diverge too much from such ratios calculated elsewhere in comparable climates unless the geology is completely different (e.g., impermeable formations near the surface in one case but not in the other). Alternatively, a water balance check can be made if, in addition to precipitation, areal evapotranspiration and direct runoff can be estimated with reasonable accuracy.
Another option is to compare the recharge estimate with the sum of baseflows and other natural groundwater discharge components in the area (springs and diffuse discharge) if such data are available. Under pre-development conditions, the long-term mean recharge should be balanced by total natural groundwater discharge; in intensively exploited aquifers, recharge is higher than the natural groundwater discharge.
In principle, observed groundwater level regimes offer additional options to test the plausibility of groundwater recharge estimates. Depending on conditions, the methods to do so vary from simple (e.g., estimating recharge contributions from rising groundwater level hydrograph limbs if the recharge is concentrated in short periods) to complex (e.g., using numerical simulation models). These options are only viable if sufficient groundwater level observations are available over a substantial extent of the aquifer system.
Back to where the text links to Exercise 11
Solution Exercise 12
Non-renewability of groundwater resources under present-day conditions is likely to occur: 1) in very dry climates (absence of significant recharge sources); 2) in permafrost regions (frozen soil and subsoil prevent water – if available in liquid form – to infiltrate); and, 3) in aquifers confined under impermeable formations. Examples for 1) are Nubian Aquifer System, NWSAS, Murzuk-Djado Aquifer System, Arabian Aquifer System; 2) Yakut Basin, West Siberian Basin (northern part); and, 3) Guaraní aquifer (confined under upper units of the Guaraní Basin).
Back to where the text links to Exercise 12
Solution Exercise 13
Groundwater quantity policy and management deal with stock (reserves) and flow (recharge, discharge) of the resource. If groundwater resources are renewable, then policies and management usually pursue sustainable groundwater development, which implies that part of the flow has to be captured and depletion of the reserves has to be avoided. Policies and management of non-renewable groundwater are fundamentally different: there is no significant recharge, thus sustainable groundwater development is not possible, and decisions have to be made on how to exploit the reserves as a function of time. It is essentially a ‘mining’ activity.
Back to where the text links to Exercise 13
Solution Exercise 14
The Maranhão Basin was chosen as an example elaborated below. Data from Margat and Van der Gun (2013), Siebert and others (2010), the internet and the methodology from Box 3 are used to estimate groundwater abstraction for the year 2010.
The basin is located in Brazil, for which the following national statistics have been found:
- groundwater abstraction: 10.06 km3, of which 3.82 km3 is for irrigation (Margat and Van der Gun, 2013, Appendix 5);
- population: 190,753,519 (Census 2010; Wikipedia4);
- area equipped for irrigation using groundwater (AEI_GW): 591,439 ha = 5,914 km2 (Siebert et al., 2010, Supplement S2; It is assumed that the 1996 data are still representative for 2010);
- total area; 8,515,767 km2 (Wikipedia5)
As a next step, it is necessary to define which administrative areas are encompassed by the Maranhão Basin. From relevant maps it is deduced that the Maranhão Basin covers the States of Maranhão and Piaui entirely, as well as approximately 40% of the State of Tocantins.
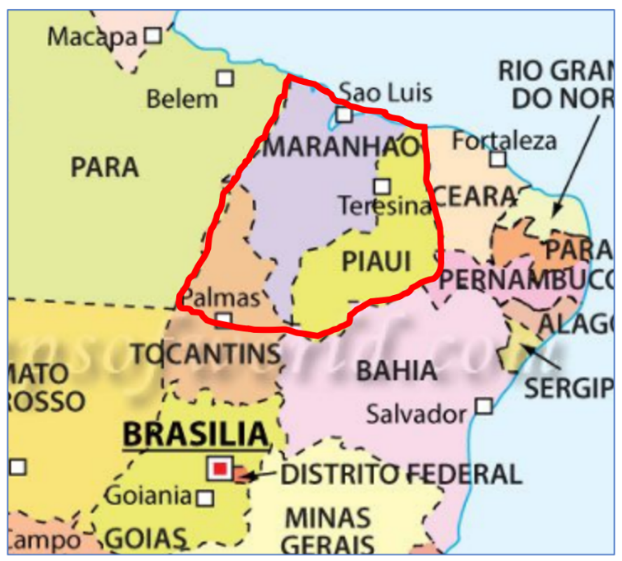
The Maranhão Basin and the States it includes entirely or partly
Using the same sources of information (Siebert et al, 2010; Supplement S2; and Wikipedia) relevant statistics are defined for the three subzones of the Maranhão Basin. Their sums are compared to the corresponding national statistics for Brazil in the table below.
Selected statistics for zones located within the boundaries of the Maranhão Basin
| State | Share* | AEI_GW (ha) | Population 2010 | Area (km2) |
| Maranhão | 100% | 19,415 | 6,574,789 | 331,112 |
| Tocantins | 40% | 434 | 553,375 | 111,088 |
| Piaui | 100% | 19,010 | 3,118,360 | 251,777 |
| Subtotal: | 38,859 | 10,246,527 | 693,549 | |
| % of Brazil: | 6.8 | 5.4 | 8.1 |
* Share is the percentage of the State located within the Maranhão Basin. Other columns indicate values for the portion of each State within the Maranhão Basin (calculated as State statistic times share).
Based on these data, groundwater abstraction for domestic and industrial uses in the Maranhão Basin for the year 2010 is estimated as the product of the population ratio (Population Maranhão Basin / Population Brazil) and the volume of water used for domestic and industrial purposes in all of Brazil.
(5.4/100) (10.06 km3 – 3.82 km3) = 0.335 km3
Similarly, groundwater abstraction for irrigation in the Maranhão Basin for the year 2010 is estimated as the product of the AEI_GW ratio (AEI_GW Maranhão Basin / AEI_GW Brazil) and the volume of water used for irrigation in all of Brazil.
(6.8/100) 3.82 km3 = 0.258 km3
Hence, the estimated total groundwater abstraction rate from the Maranhão Basin is approximately 0.59 km3/year, which is equivalent to a water depth of 0.85 mm/year spread over the area of the Maranhão Basin.
These values are identical to those included in Table 7, because exactly the same data and assumptions have been used. Relying on different data sources (statistics vary often slightly from one source to another) and/or different assumptions (e.g., on which areas to include in the basin) is likely to result in values that may differ from the ones shown above, even by a factor two.
Back to where the text links to Exercise 14
Solution Exercise 15
A potential source of error related to all methods is the difficulty to isolate the long-term trend from shorter-term water level variations (interannual variation, cyclic climatic variations). Data over a sufficiently long period of years are needed to derive a reliable medium- to long-term linear trend. Different trends may be calculated for different periods. The primary error sources specific to each of the three methods are listed below.
Method 1 (water level changes times storativity)
- The assumed mean value of specific yield is not sufficiently representative of the corresponding unconfined aquifer.
- Poor information on groundwater level variations in space and in time (insufficient areal coverage; observation wells not corresponding to the phreatic aquifer unit; a short period of observation).
- These flaws also apply to confined aquifers if these are expected to have a significant contribution to depletion (e.g., in cases of very thick and porous aquifers).
Method 2 (gravity changes over time – GRACE):
- Isolation of the groundwater-related component from the total gravity anomaly.
- Allocation of the calculated groundwater anomalies to the spatial unit covered by the mega aquifer system under consideration.
Method 3 (numerical modeling):
- Insufficient information/knowledge about the hydrogeological structure and hydraulic parameters of the aquifers concerned.
- Poor information/knowledge about the boundary conditions (especially their variation over time).
Back to where the text links to Exercise 15
Solution Exercise 16
Five intensively exploited mega aquifer systems facing exceptional water quantity sustainability challenges include the Central Valley (CV), the High Plains (HP), the Indus Basin (IB), the Ganges-Brahmaputra Basin (GBB) and the North China Plain Aquifer System (NCP).
Several current or anticipated impacts of intensive exploitation are shared by all five: falling water levels resulting in increased groundwater abstraction cost; wells running dry; exhaustion of certain aquifer zones in the longer term; migration of poor-quality water into zones with fresh groundwater of good quality; and, environmental degradation of groundwater-dependent ecosystems. Groundwater salinization by seawater intrusion is an issue in the coastal zone of the North China Plain (NCP), the Ganges-Brahmaputra delta (GBB) and the Indus coastal zone (IB). Land subsidence affecting large areas is a prominent impact of intensive groundwater development in the North China Plain and the southern half of the Central Valley (San Joaquin Valley). A major impact of intensive groundwater development in the Indus and Ganges-Brahmaputra basins is groundwater quality degradation by influxes of saline or brackish groundwater, natural contaminants (arsenic and fluoride) and/or anthropogenic pollutants. Continued groundwater storage depletion implies a finite lifespan of the aquifers. Groundwater storage depletion reached 14% of predevelopment storage in 2003 in the Central Valley and 8% in 2007 in the High Plains Aquifer System. In one-third of the southern part of the latter, the saturated aquifer thickness is expected to decrease to less than 6 m by 2040, thus putting an end to intensive groundwater abstraction.
Options for controlling the situation include managed aquifer recharge (MAR), but this is not practiced in any of the intensively exploited aquifer systems to an extent sufficient to establish sustainable conditions. Therefore, direct or indirect demand management measures are needed if control is pursued. These include strict regulation of groundwater pumping (only feasible in some areas), registration of wells, permits for new wells, water use fees, groundwater protection zones, recycling used water, substituting groundwater use with surface water use, using brackish groundwater (where feasible), increasing irrigation efficiencies, changing cropping patterns to those with lower water demand, water-saving techniques in households and industry, adequate practices in energy supply and modified subsidies related to groundwater development. Effective control requires the presence of good groundwater governance provisions and general public support.
Back to where the text links to Exercise 16
4List of Brazilian States by Population
5List of Brazilian states by Area