3.2 Groundwater Abstraction
3.2.1 Groundwater Abstraction Estimates
Assessing groundwater abstraction from an aquifer or aquifer system is rather difficult, too, although somewhat easier than assessing groundwater recharge. Most reliable data are obtained if the wells are equipped with flow meters, but this is expensive and in practice mostly limited to important groundwater production wells or wellfields (e.g., public water supplies). Metering is relatively rare among the myriads of privately owned and/or operated wells. A comprehensive well inventory (including measurement of well yields and enquiring about the average daily number of hours of pump operation) is another reliable method to estimate groundwater abstraction in a particular area, but this approach needs to be carried out within a restricted time frame, it requires considerable effort and financing and becomes impracticable if the aquifers are large. Therefore, many estimates of groundwater abstraction from aquifers are based on indirect monitoring methods, including sampling among main categories of groundwater users to define representative unit groundwater-use values; extrapolating or disaggregating based on demographic, land use, irrigation and agricultural/industrial production data; correlation with energy consumption records or well-licensing data; remote sensing (satellite or airborne sensors).
For this overview, an attempt has been made to collect or produce estimates of the annual groundwater abstraction rates for the mega aquifer systems. The results are presented in the fifth and sixth columns of Table 7, showing groundwater abstraction rates in km3/year and mm/year, respectively. Since groundwater abstraction is time-dependent, synchronization has been pursued, with the year 2010 chosen as the preferred common reference year. Nevertheless, for several mega aquifer systems, the only available estimates refer to another year; these estimates are included in cases when the other year was close enough to 2010 to assume the abstraction rate would be similar, or the estimates have been extrapolated, using an assumed annual growth rate. As was done with the recharge estimates, all reported abstraction estimates have been rounded to no more than two significant digits in Table 7, because more precision is not realistic.
The groundwater abstraction estimates shown in Table 7 can be divided broadly into four categories.
- Tailor–made estimates for the individual mega aquifers system as provided by authors of aquifer-specific papers or reports. On average, these are probably the most reliable estimates, but the margins of uncertainty are still considerable, as is suggested by the differences between alternative estimates made for single mega aquifer systems. Values are only included if they were found in publications of satisfactory professional standard.
- Estimates as produced by combining groundwater abstraction statistics reported for separate sub-national administrative areas or separate aquifer units that form parts of the mega aquifer system being considered. Such estimates tend to be reliable as well, provided that the abstraction statistics are of good quality, and that the mentioned administrative areas, or aquifer units, represent the mega aquifer system comprehensively and correctly.
- Estimates as produced by disaggregating national groundwater abstraction statistics. The adopted approach assumes that groundwater abstraction for irrigation is proportional to the area irrigated with groundwater and that domestic plus industrial groundwater abstraction is proportional to population size. The method is illustrated in Box 3, using the Paris Basin as an example. These indirectly obtained estimates are no more than ‘educated guesses’, satisfactory for a first impression. Nevertheless, their reliability may be rather high if the mega aquifer system considered (or its national segments) covers a greater part of the national territory (or territories).
- Estimates as produced by combining some of the former three approaches.
Although it is not easy to define the reliability of the groundwater abstraction estimates, the consulted literature supports the impression that those of the Nubian Aquifer System, the Northern Sahara Aquifer System, the Central Valley, the High Plains, the Paris Basin, the Arabian Aquifer System, the Indus and Gangetic-Brahmaputra Basins, the North China Plain (Hai Plain) and the Great Artesian Basin are reasonably reliable. In contrast, estimates for the Ogaden-Juba, Sudd and Congo Basins, the Northern Great Plains, the Cambrian-Ordovician Basin and the Song-Liao Plain carry a large margin of uncertainty, although there is little doubt that the order of magnitude of all presented estimates is correct.
A few comments on missing estimates. Statistics on population and groundwater-irrigated land suggest that groundwater abstraction in the Greater North China Plain is almost twice that in the North China Plain (Hai Plain), thus it is estimated to be approximately 40 km3/year. Groundwater abstraction in the five easternmost mega aquifer systems of the Russian Federation is likely very low since there are no significant areas of irrigated land and only a limited population. The total population of all five areas was approximately 23 million in 2010 (16 percent of the Russian Federation’s population), of which 17 million live in the huge West-Siberian Basin (mostly in its southern part). The combined abstraction of these five mega aquifer systems, therefore, is unlikely to have exceeded 2 km3 in 2010.
3.2.2 Interpreting and Comparing the Estimates
Share of the Mega Aquifer Systems in Global Groundwater Abstraction
Based on the estimates shown in Table 7, the total rate of groundwater abstraction from the 37 mega aquifer systems (for the reference year 2010) is calculated as approximately 375 km3/year, which is 38 percent of the global rate of groundwater abstraction of 982 km3/year estimated for the same year 2010 (Margat and Van der Gun, 2022). Using 375 km3/year abstraction from 35 million km2 of mega aquifer area, the average depth of water extracted is 10.7 mm/yr. Then the remaining 607 km3/year of groundwater abstraction comes from the remaining 99 million km2 of continental surface (excluding Antarctica) for which the average depth of water extracted thus is 6.1 mm/yr. Despite the uncertainties in the estimates, it is reasonable to conclude that the average intensity of groundwater abstraction in the areas of mega aquifer systems is substantially greater than in other areas (almost twice). This is no surprise as the mega aquifer systems offer comparatively favorable conditions for groundwater abstraction. The mega aquifer systems thus play a prominent role in global groundwater development by providing a very significant share of all abstracted groundwater.
Variation of Abstraction Rates and Mean Abstraction Intensity
What catches the eye in Table 7 is the large variation in the rates of groundwater abstraction. Eight mega aquifer systems have very high estimated abstraction rates (above 10 km3/year); in decreasing order: the Ganges-Brahmaputra Basin (110 km3/year), the Indus basin, the Greater Northern China Plain, the Atlantic and Gulf Coastal Aquifer System, the High Plains, the Arabian Aquifer System, the Central Valley and the Song-Liao Plain (13 km3/year). Together they produce around 340 km3/year, which is 90 percent of the combined abstraction from all 37 mega aquifer systems, or 35 percent of the global groundwater abstraction. These intensively exploited systems are supplying groundwater to very large areas of irrigated lands and most of them have a huge number of people within their boundaries. The estimated abstraction rates are much lower (ranging from 10 down to 1 km3/year), but still considerable, for eleven other aquifer systems; in decreasing order: the Russian Platform Basins (8 km3/year), the Nubian Aquifer System, the Tarim Basin, the North-Western Sahara Aquifer System, the Paris Basin, the Guarani Basin, the Murzuk-Djado Basin, the Cambrian-Ordovician Aquifer System, the North Caucasus Basin, the West-Siberian Basin and the Karoo Basin (1 km3/year). The estimated abstraction rates of the remaining eighteen mega aquifer systems are relatively low, below 1 km3/year. The lowest abstraction rate (no more than 0.1 million km3/year) probably corresponds to the Pechora Basin, 350 thousand square kilometers in size but with only a few hundred thousand inhabitants. In terms of groundwater abstraction intensity, expressed in mm/year (equivalent to thousands of m3 per year per square kilometer), the ranking is led by the Indus Basin (300 mm/year), followed by the Central Valley, the Ganges-Brahmaputra Basin and the Greater North China Plain (120 mm/year), as shown in Table 7 and Figure 14.
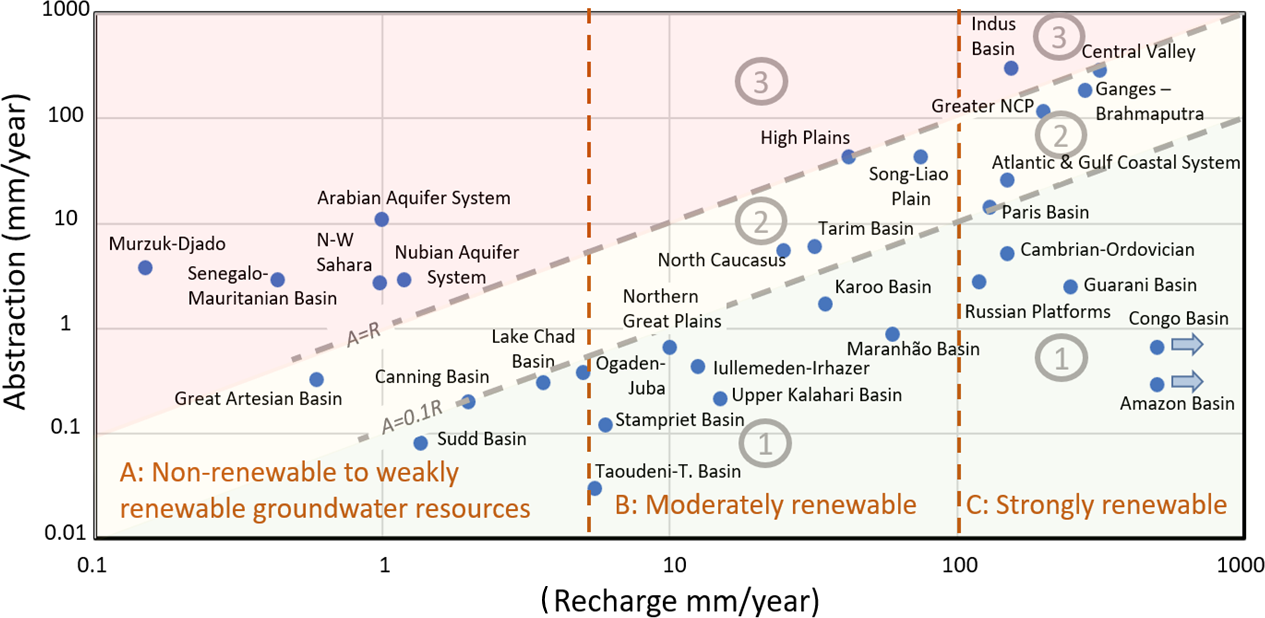
Figure 14 – Classification of the mega aquifer systems according to their mean rate of groundwater recharge and renewable groundwater development stress (reference year: 2010). Note that the differently colored zones 1, 2 and 3 represent distinct groundwater development stress intervals.
Classification According to Mean Recharge and Renewable Groundwater Development Stress (RGDS)
It is interesting to explore to what extent groundwater abstraction is modifying the overall regime of the mega aquifer systems. For this purpose, the estimates of groundwater recharge and abstraction estimates in Table 7 are both shown in mm/year. Figure 14 presents these values graphically, which facilitates classifying and comparing them provisionally, assuming that the estimates do not diverge too much from the corresponding true values.
A few comments may be helpful for properly understanding the diversity of conditions:
- Class A in Figure 14 includes aquifers with non-renewable or only weakly renewable groundwater resources (recharge rate R < 5 mm/year), typical for regions with a very dry climate. Most of the mega aquifer systems of Northern Africa, as well as those on the Arabian Peninsula and in Australia belong to this class. The hydrological impact of continuing and increasing abstraction from aquifers in this category will mainly consist of groundwater storage depletion at rates close to the abstraction rates.
- Class B represents moderately recharged aquifer systems (R between 5 and 100 mm/year) and is subdivided into three subclasses, according to the renewable groundwater development stress RGDS (defined as the quotient of groundwater abstraction over mean recharge, often expressed as a percentage). Sub-class B1 (RGDS < 10 percent) includes mega aquifer systems that are developed at only rather low rates (such as the remaining aquifer systems in dry regions of Africa), while those in the sub-classes B2 and B3 (RGDS > 100 percent) are characterized by moderate to intensive and very intensive total abstraction rates, respectively, associated with high population density and/or large extents of irrigated lands. Groundwater abstraction is balanced by both a reduction of natural groundwater discharge and groundwater storage depletion, but the latter becomes dominant under intensive groundwater abstraction regimes, which is most pronounced in the High Plains aquifer.
- The mega aquifer systems in class C enjoy higher mean recharge rates than those in class B (> 100 mm/year), but they are subdivided similarly into three subclasses. The overall hydrological regimes of the mega aquifer systems in sub-class C1, in particular the Amazon and Congo basins, are still close to pristine. However, groundwater development stress increases steadily with increasing groundwater abstraction intensities and has significant impacts on the hydrological regimes of the mega aquifer systems in the sub-classes C2 and C3.
- Theoretically, the mega aquifer systems in the subclasses B3 (High Plains aquifer), C3 (Indus Basin, Central Valley) and several in class A (Arabian Aquifer System, Murzuk-Djado and the Senegalo-Mauritanian basins, the North-Western Sahara Aquifer System and the Nubian Aquifer System) will never reach a dynamic hydrological equilibrium under current recharge and abstraction rates. They are the first ones where storage depletion trends are to be expected. Nevertheless, considerable storage depletion may also occur at lower development stress levels, in particular in aquifer systems in the B2 and C2 subclasses.
- It is emphasized that the above characterization refers only to the macro-behavior of the mega aquifer systems (at a spatially lumped scale). At local scales, parts of the aquifer systems may face entirely different conditions, for example, significant local storage depletion in aquifer systems that have a low overall RGDS.
- It is reiterated here that most of the estimates – especially those of recharge – are subject to considerable uncertainty. The classification is therefore only tentative and may for some aquifer systems diverge from reality. Furthermore, conditions in specific aquifer segments may significantly differ from those aggregated for the entire aquifer system.