5.2 Local Meteoric Water Lines
A meteoric water line for a region is known as the Local Meteoric Water Line (LMWL) and is usually essential for interpreting stable isotope data. It is ideally generated by using only precipitation samples (not surface or groundwater samples), and samples that capture all of the precipitation in a region over several years, to be representative of unusual weather events and climatic oscillations, such as El Niño or the North Atlantic Oscillation.
The LMWL can be thought of as representing the default or input stable isotope values to the local hydrological cycle. It is different from the GMWL because the local area has a limited range of climatic conditions and weather systems, thus produces a limited and more specific range of stable isotope values compared to the global dataset (Araguas-Araguas et al., 2000). Comparison of groundwater, surface water and particular precipitation events to the LMWL allows investigation of processes such as water-rock interaction, evaporation, recharge and mixing (Jasechko, 2019) as illustrated in Figure 11.

Figure 11 – A conceptual diagram showing typical isotope compositions of various water bodies and differences in the LEL (local evaporation line), LMWL (local meteoric water line) and GMWL (global meteoric water line) for a specific region. These differences in slope and position allow interpretation of stable isotope data so as to begin formulating hypotheses about water sources, sinks and interactions in a study region.
Most LMWLs have slopes of < 8, usually around 5 to 7 and a notably limited range of δ2H and δ18O values compared to the GMWL. When several LMWLs for areas with different climates are drawn, these lines lie semi-parallel, but are displaced ‘up’ or ‘down’ on a δ2H-δ18O plot and stack adjacent to each other to form the GMWL, as shown in Figure 12. The GMWL is the cumulative result of all the LMWLs for regions of different climate, with degree of rainout being the main discriminant for the position of each LMWL. LMWLs for higher latitude regions tend to plot lower on a δ2H-δ18O diagram whereas LMWLs for lower latitude and more arid regions tend to plot higher on the diagram.
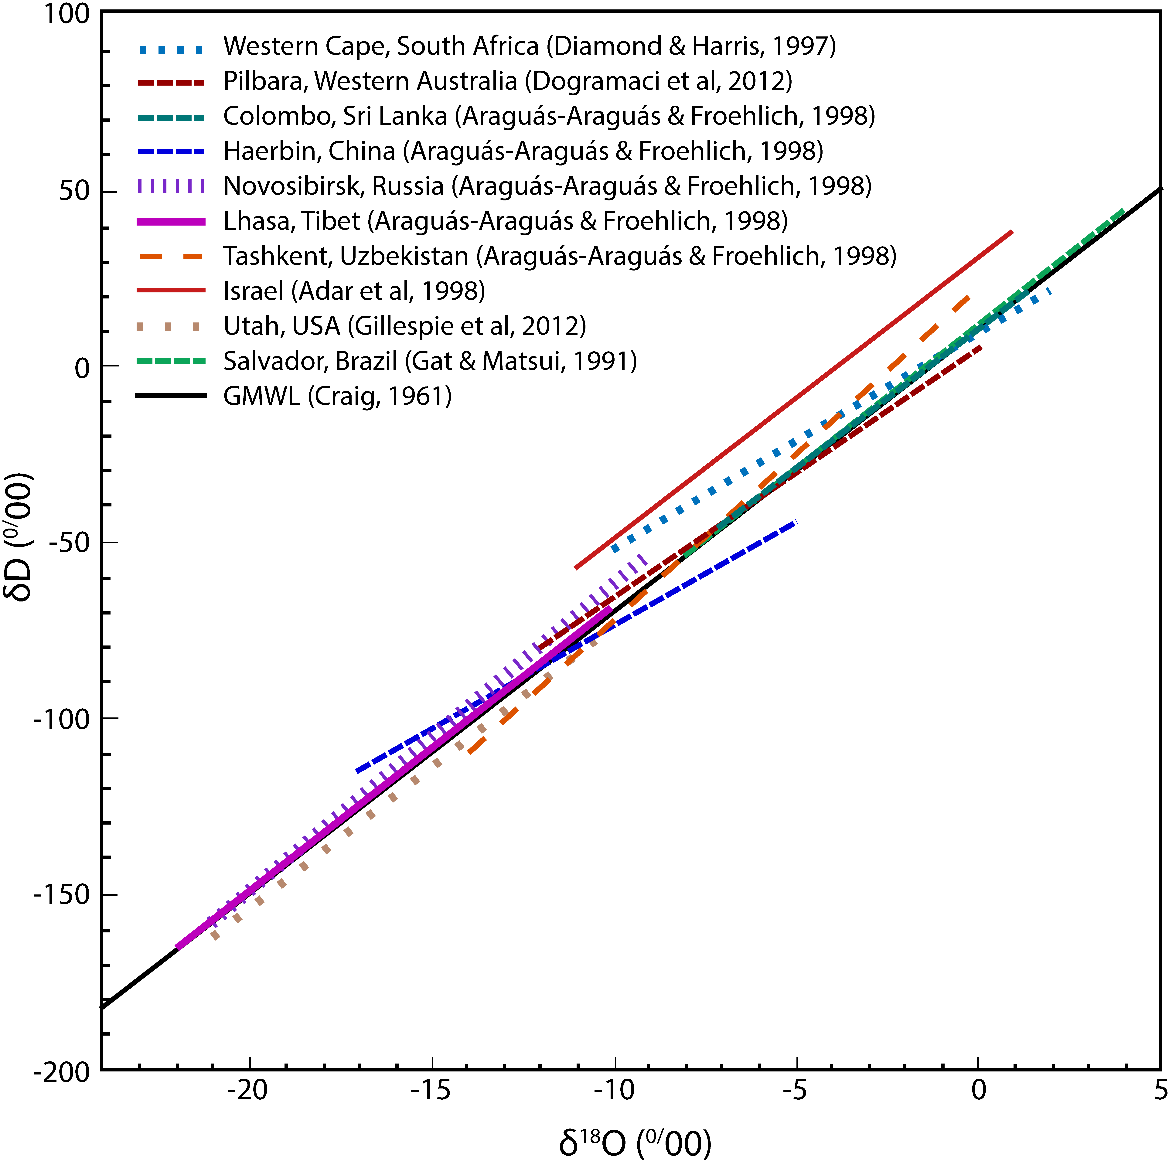
Figure 12 – Local meteoric water lines (LMWLs) for various regions of the world, and the GMWL.