6.3 Event Variation
As stated in the introduction, knowledge of the whole hydrological cycle is often needed to unravel groundwater questions, and although the cycle has no end or beginning, the isotopic signature of precipitation is a good point to begin. This is particularly true for groundwater, as precipitation precedes recharge. Most hydrogeological studies make use of bulk isotope values for precipitation, typically monthly cumulative samples, as per the IAEA GNIP (International Atomic Energy Agency, Global Network for Isotopes in Precipitation) program, allowing calculation of a MWL, assessment of seasonality in isotope values, and generation of the mean annual isotope composition. This approach is sufficient for many groundwater applications.
However, some studies have analyzed the isotopic composition daily (Sanchez-Murillo et al., 2016), per event (Qu et al., 2014), within-event (Harris et al., 2010) and even down to 30 second increments (Munksgaard et al., 2012). The results show a tremendous variation in isotope composition of rain over short timeframes. From one location and a set of nine rain events totaling 15 days over 8 months, Munksgaard and others (2012) reported -140 to +13‰ in δ2H and -19.6 to +2.6‰ in δ18O, capturing as much variation as the monthly cumulative samples across the whole continent of Australia over a period of 40 years.
Although the isotopic variation of a rain event is mostly dependent upon the type of event and its duration, typical variations are on the order of 10-50‰ for δ2H and 1-5‰ for δ18O (Han et al., 2020; Harris et al., 2010; Muller et al., 2015). Different studies have noted different trends. Harris and others (2010) found less δ variation in a shorter (5 hour), heavier rain event associated with a cold front from the South Atlantic passing over Cape Town as opposed to a larger, more complex frontal system lasting more than a day. Qu and others (2014) similarly found more variation in δ values during larger storms for the subtropical monsoon climate of eastern China, and Han and others (2020) saw variability decrease during an event (Figure 22).
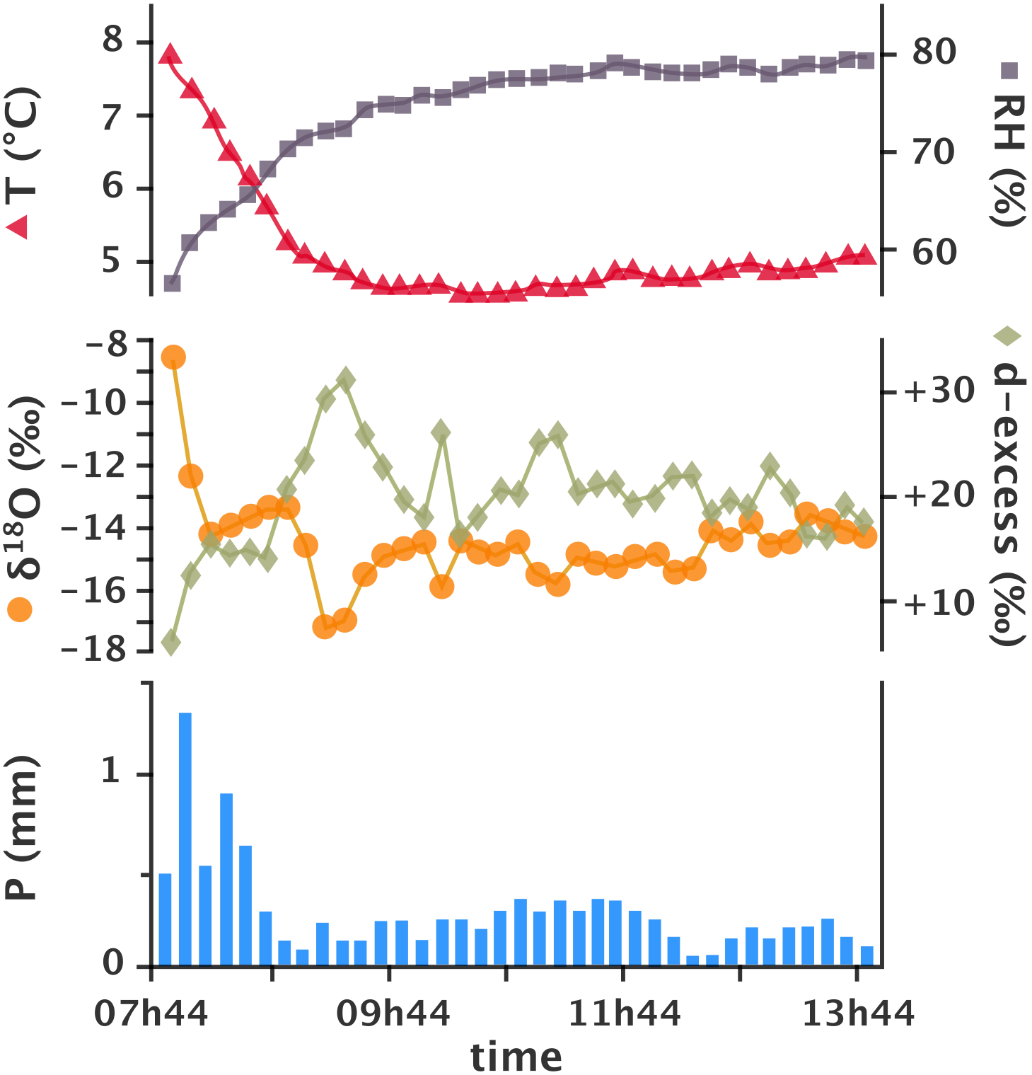
Figure 22 – Variation of oxygen isotope composition with time, during a single rain event of several hours is revealed by analyzing 10-minute increment samples of the precipitation. This event exhibits an L-shaped trend in isotope composition, as well as stabilization of the variations with time (after Han et al., 2020).
From a review of previous work, Muller and others (2015) noted several intra-event patterns of change in isotope composition over time. These were increasing, decreasing, V-shaped, W-shaped, L-shaped and no-trend. The most common of these are the increasing, decreasing, V-shaped and L-shaped. They also found a general relationship that δ values are inversely proportional to rain rate, in other words, heavier rain is associated with lighter isotopes. This is not quite the same as the amount effect, where lighter isotopes are associated with larger total precipitation amounts (and not higher precipitation rate). For example, Sanchez-Murillo and others (2016), working in Costa Rica, where one would expect an amount effect due to its tropical latitude, took daily precipitation samples and found humidity and condensation levels to best correlate with isotope composition, and not precipitation amount. In contrast, Han and others (2020) found relative humidity to have no effect on isotope values, but saw that fresh input of an air mass into the weather system can renew the system with heavy isotopes and make the values of the event increase. Adar and others (1998) hypothesized that rain from different parts of the storm system can also cause variations in the isotope composition of rain.
In understanding infiltration, runoff and other parts of the water cycle, a single sample for the total precipitation of a whole event is clearly going to obscure some of the detail. In a desert setting in Israel, Adar and others (1998) saw that some events of < 1 mm precipitation triggered runoff. If one wants to understand the detail on a site, high-frequency, sub-event rain monitoring may be needed, and if trying to understand a whole catchment, then sufficient spatial coverage may also be needed. Fortunately, the low cost and high speed of analysis with laser cavity instruments makes this type of science possible for researchers even on moderate budgets. The potential for application to understanding vadose zone processes, ecological issues, triggers for fracture flow, and other poorly understood aspects of hydrogeology, are tantalizing.