6.5 Hydrograph Separation
Hydrographs are charts showing the amount of water flowing in a river over time. A hydrograph reflects the sum of the contributions to flow. Catchment water balance theory tells us the river flow at a point has a set of possible contributions, which, when there is no precipitation occurring and no flows provided by human activities, can only be groundwater, from both the phreatic and vadose zone, the latter sometimes called soil water or interflow. During a precipitation event or storm, the possible contributors also include direct precipitation (onto the river surface) and overland flow or runoff. In general, direct precipitation is negligible and interflow (from the vadose zone) is often assumed to be negligible, and so this leaves runoff and groundwater as the main sources of river flow during a storm as illustrated in Figure 23.
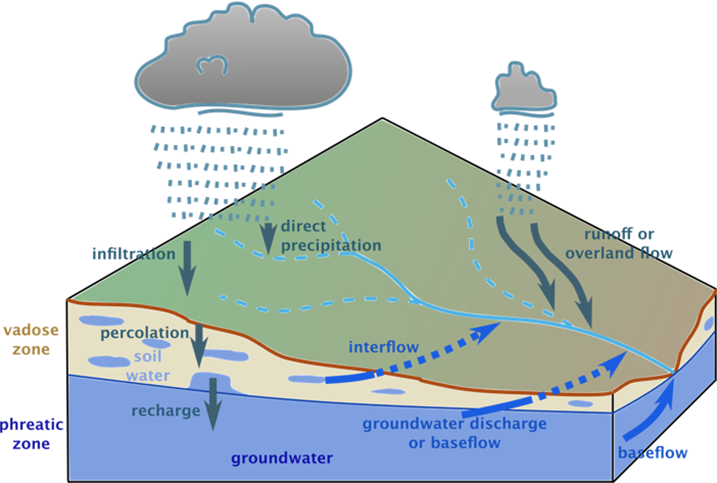
Figure 23 – Schematic diagram of the main flows of water in a natural catchment. Inclusion or exclusion of each flow in a model depends on the degree of detail in the model, data availability and the catchment itself.
Hydrograph separation involves apportioning the river storm flow into components. In the past, this was done graphically by comparing the baseflow (fairly constant flow) and quick flow (rapidly rising and falling component of flow due to a storm) portions of the hydrograph and assuming that quick flow was mostly due to runoff. The assumption that the precipitation from a rain event is transferred to the stream via runoff was shown to be inaccurate in many parts of the world, especially after analysis of conservative tracers (e.g., H and O isotopes, Cl) in the water (Sklash and Farvolden, 1979; Hooper and Shoemaker, 1986). Although some hydrologists still use graphical methods to attempt hydrograph separation, many are of the opinion that this is as misleading as it is beneficial, with Beven (2001) stating “the best method of dealing with hydrograph separation is to avoid it altogether”.
Natural tracers, such as dissolved ions and isotopes, both stable and radioactive, provide a different way of performing hydrograph separation. Each component or possible contributor to river flow can be characterized, such as groundwater and precipitation. For a 2-component system, the total river flow is then compared to these using a mixing line between the components and can provide an estimate of the proportions of groundwater and rainwater in the river. Isotopes in particular, due to their non-reactivity in aquifers, are ideal tracers, better than most dissolved species, as the latter often undergo various reactions and transitions. Certain conditions should be met to apply this method successfully, as stated by Sklash and Farvolden (1979).
“(1)The isotopic content (18O, D or T) of the event component is significantly different from that of the pre-event component.
(2)The event component maintains a constant isotopic content.
(3)The groundwater and vadose water are isotopically equivalent or vadose water contributions to runoff are negligible due to hydrogeologic constraints.
(4)Surface storage contributes minimally to the runoff event.”
If these guidelines are applied (Laudon and Slaymaker, 1997), hydrograph separation using natural tracers may be reasonably successful. However, the study area may deliver complexities that cannot be easily resolved, or the study itself may be inadequate, rendering this simple approach less valuable (Klaus and McDonnell, 2013). To be more specific, Hooper and Shoemaker (1986) noted isotope compositions of various components to be indistinguishable at times and snowmelt contributions to vary over time, in a study in New Hampshire. The co-variation of δ2H and δ18O has been used to dismiss use of both of these tracers, however, Lyon and others (2009) find that each element gives a different result. Use of both is not as robust as two totally independent tracers, for example δ18O and SiO2, but it is better than using only one. Also, as mentioned, the stable isotopes are least likely to undergo changes from reactions with the aquifer, other water types or the atmosphere.
One of the major challenges is estimating the isotopic compositions of the different components, also called end-members. Pu and others (2017) observed how sensitive their calculations were to their end-member estimates, and Penna and Van Meerveld (2019) used the observed variations in values for end-members from 148 studies to calculate the typical error due to natural variations of isotopes in groundwater, precipitation, streamflow and other components. They computed a value of 26 % for the variation, or error, in the estimates of final flow components. Another common issue is the number of components. In many cases flow originates from more than groundwater and precipitation. Snowmelt, glacier melt, surface storage (pre-existing water that becomes a flow component after precipitation) and vadose zone water may all contribute significant flows during an event. In these cases, a 3-component hydrograph separation is more likely to capture the main sources of flow (Klaus and McDonnell, 2013), such as groundwater, meltwater and runoff for a study on the Ganga River in the Himalaya (Maurya et al., 2011) or glacier melt, snowmelt and runoff at the Gangotri Glacier, also in the Himalaya (Rai et al., 2019). The latter study used a 2-component model on non-rainy days to determine that glacier melt and snowmelt were two distinguishable components, and therefore were able to apply the more complex 3-component model in rainy weather.
The results of isotopic hydrograph separation are therefore variable in accuracy, and often incorporate hydrochemical parameters, as does much other work in stable isotope hydrology. However, many studies have undertaken isotopic analysis of the various hydrological flows in catchments in order to estimate the groundwater contribution to surface water flow (Jasecko, 2019). The results show that the ratio of groundwater to runoff as contributions to total river flow vary from catchment to catchment, and also within the same catchment, but under differing weather conditions (Camacho Suarez et al., 2015). Some studies, for example Iqbal (1998), continue to show that precipitation tends to recharge groundwater, driving an increase in baseflow, causing quick flow to have an isotopic composition closer to groundwater than event water, as shown in Figure 24.
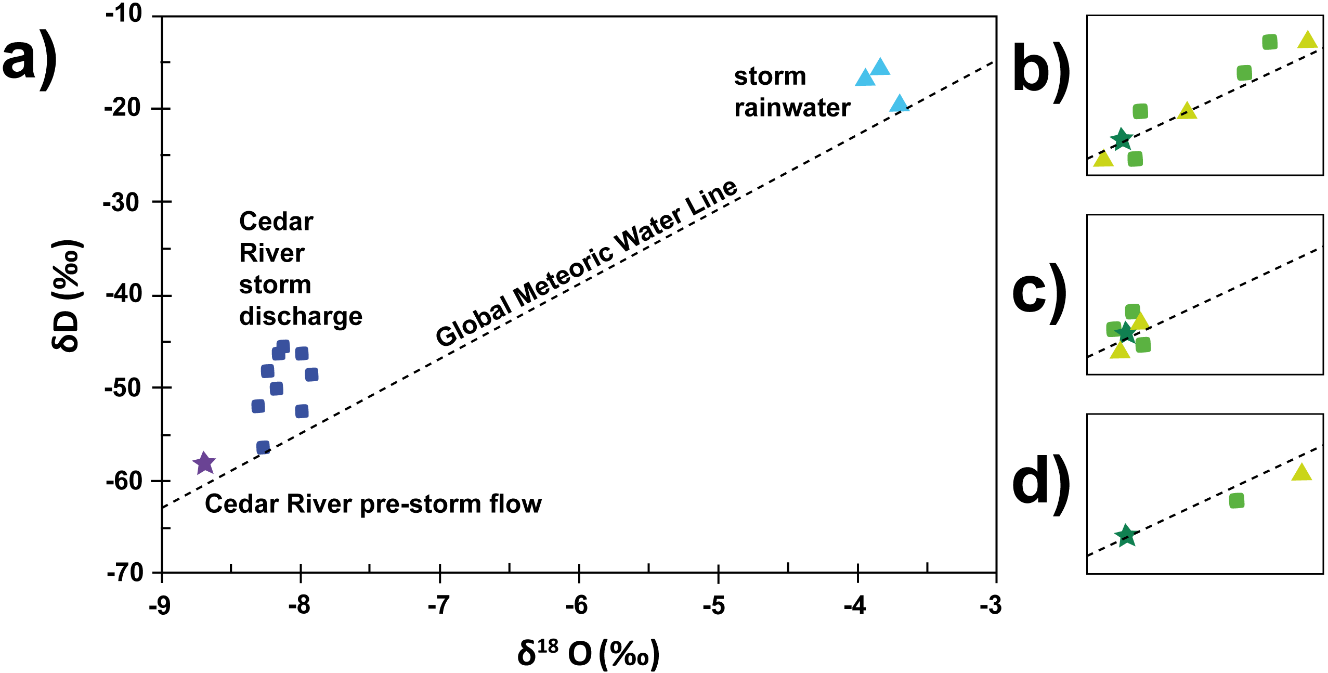
Figure 24 – a) Stable isotopes for the Cedar River catchment, Iowa, USA (Iqbal, 1998). The final storm discharge in the river (blue squares) is assumed to comprise two components, namely groundwater discharge (purple star) and precipitation (turquoise triangles). The proportions that these two components contribute to the storm discharge can be calculated by measuring the graphed distances along a straight line between all 3 water types. In this case the distance between the pre-storm data point and the storm water discharge data points is about 0.15 of the total distance between the pre-storm and the rainwater data points, whereas the distance between the storm discharge and the rainwater data points is about 0.85 of the total distance, indicating the groundwater contributes roughly 85 percent of the storm discharge. The spread of data and number of samples in this case suggest this method is applicable. In contrast, scenarios where this method is not applicable are shown in the insets: b) too much scatter of the data resulting in high standard deviation of the estimate; c) too little variation of the data such that, statistically, their means that are not significantly different; and, d) too few samples producing statistically uncertain results.
Another study, shown in Figure 25, used data from a seasonal period to show that quick flow is mostly event water. It was theorized that this was due to steep slopes, poor aquifers and compaction of soils from agriculture in the basin (Tekleab et al., 2014).
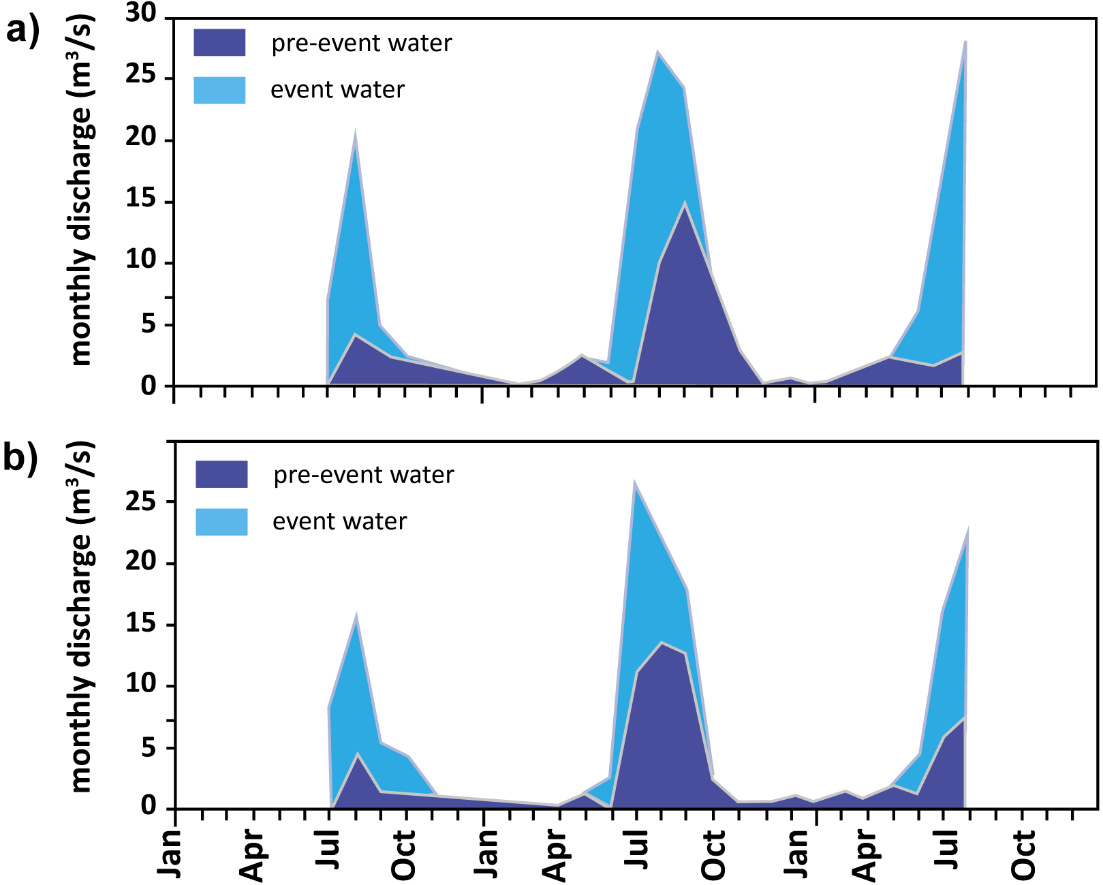
Figure 25 – The results of a classic two-component hydrograph separation performed using δD and δ18O over a seasonal period for the a) Chemoga and b) Jedeb catchments in Ethiopia. The proportion of event water in the river flow was calculated to be an average of 71 percent and 64 percent in the two catchments respectively (from Tekleab et al., 2014).
Hydrograph separation is a worthy pursuit, and although some progress has been made in improving the procedure, more integration of physical, chemical and isotopic evidence is likely to bring greater understanding (Kirchner, 2003).