4.2 Past Deformation and Present Stress-Field Effects on Fracture System Properties
Lithological types have a strong influence on the configuration of the fracture network in two ways.
- Layers of contrasting mechanical behavior control the propagation of fractures, giving rise to bed-confined fractures with spacing that is usually related to the thickness of the layer
- Lithologies with pre-existing anisotropy and discontinuities (which is inherent to some lithologies) are frequently reactivated during brittle deformation resulting in a large number of fractures along pre-existing structural features such as bedding planes, foliation and veins.
Furthermore, the configuration of the fracture network strongly depends on the brittle deformation history, that is, on the deformation intensity and the orientation of the stress fields of the tectonic events that have affected a region. The brittle deformation, especially in older crystalline basement and volcano-sedimentary basins, which usually occupy vast areas on all continents, has probably taken place over a large time span; thus, the superposition of several brittle tectonic events is common. For example, the Precambrian crystalline rocks that crop out in large regions of Brazil began to intensively deform in a brittle manner at least in the Early Cretaceous, with important deforming events in the Cenozoic including the Quaternary period.
These long deformation histories usually produce several fracture sets under different tectonic regimes, and the interaction of the fractures thus formed influence the configuration of the fracture network. Four types of interactions can be deduced from the observation of fracture traces on outcrops (Figure 56 and Figure 57):
- an older joint trace offset by a younger fault;
- a younger joint trace abutting against an older joint trace;
- short traces of older sealed joints cut by the long trace of younger joint; and,
- crossing traces of joints.
Younger fractures abut against older fractures, likely because of voids along the latter. This is shown in the second image of Figure 56 and occurs in the orthogonal pattern that contains systematic (older) and cross (younger) joints, and also in the gridlock pattern (Figure 58a,b). However, in the latter (Figure 58b), the mutual abutting relationships between the two orthogonal sets indicate that they were formed under tectonic conditions characterized by the alternation of σ2 and σ3 orientations (Dunne & Hancock, 1994). Specific “conditions of internal tensions during the final stages of joint development” is another possible explanation for the gridlock pattern development (Rives et al., 1994).
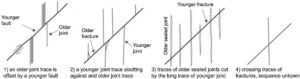
Figure 56 – Fracture interactions and interpretation of the relative ages (modified from Dunne & Hancock, 1994).
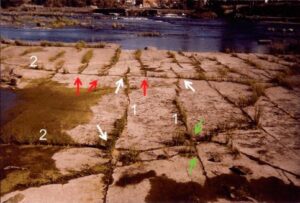
Figure 57 – Horizontal outcrop of quartzite of the Theresa Formation in the St. Lawrence Lowlands, southern Québec, Canada, showing two well-defined vertical fracture sets; set 1 abuts against set 2 at 90° (red arrows), implying that set 2 is older than set 1. Set 1 can also cut across set 2 at some location (white arrows). Other fractures (green arrows) are more irregular and seem to abut against set 1 (photograph: Alain Rouleau).
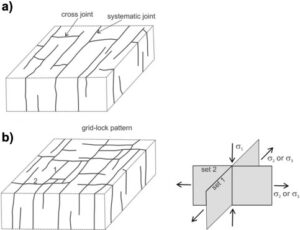
Figure 58 – The abutting relationships of two orthogonal joint sets unveil different deformation histories. a) The systematic and cross joint pattern indicates older and younger ages, respectively. b) Sets 1 and 2 form a gridlock pattern characterized by mutual abutting relationships; a possible explanation is that they were formed in a tectonic setting in which σ2 and σ3 alternated orientation over time (modified from Dunne & Hancock, 1994).
Idealized sketch of a horizontal rock exposure with three sets of joints with type 2 terminations as shown in Figure 56. Set 3 (N60E direction) abuts against set 1 (N45W) and set 2 (N5E), while set 2 abuts against set 1. These interactions provide evidence that set 1, the more persi tent, is the oldest and that set 3 is the youngest. By the time a younger fracture set propagates, the stress field is perturbed by the presence of
older fractures. This is why the traces of the younger set may bend as they approach the traces of the older fracture set.
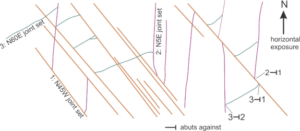
Figure 59 – Idealized sketch of a horizontal rock exposure with three sets of joints with type 2 terminations as shown in Figure 56. Set 3 (N60E direction) abuts against set 1 (N45W) and set 2 (N5E), while set 2 abuts against set 1. These interactions provide evidence that set 1, the more persistent, is the oldest and that set 3 is the youngest. By the time a younger fracture set propagates, the stress field is perturbed by the presence of older fractures. This is why the traces of the younger set may bend as they approach the traces of the older fracture set.
The architecture of the fracture network that arises from cross-cuttings and abutments (Figure 56) has significant consequences on groundwater flow pathways. Considering the fracture configuration in Figure 59, if set 1 contains the most transmissive fractures, flow pathways will be long in the NW direction. However, if set 3 is the most transmissive and set 1 generally impermeable, then the flow paths will be short, along the NE direction, and mostly interrupted by set 1. Thus, the succession of brittle deformation events over time is an important topic of investigation for construction of conceptual models.
The effect of the current stress field on the fracture network is another important topic of investigation because it can influence the variability of transmissivity of fracture sets. A review of the current tectonic stress fields worldwide is presented by Zoback and others (1989). These are expressed in terms of orientation of the maximum horizontal stress, SHmax, at each location and the corresponding tectonic regime. Data on the orientation of contemporary principal stresses are obtained mostly from seismicity, wellbore breakouts (elliptical sections of wells) and geological data. As described in Section 2.3, tectonic stresses in the crust are driven by global scale (i.e., tectonic plate movement and interaction) and regional scale (i.e., bending due to surface loadings) forces.
Contemporary tectonic stresses can reach regional significance even at shallow depths, which is the domain of most fractured aquifers. One example is the roughly EW direction of SHmax in the South American plate interior obtained from Holocene fault data and seismicity as shown in Figure 60. This EW direction of SHmax is in agreement with the stress models for the South American plate (Riccomini & Assumpção, 1999). Some observed discrepancies regarding the orientation of SHmax for different areas have been attributed to the interaction of regional and local tectonic stresses. Besides the active tectonic stresses due to present-day straining of the Earth’s crust, remnant stresses related to paleotectonic events (e.g., Zang & Stephansson, 2009) may affect specific rocks of a region and impose variability on the orientation and magnitude of the current stress field. The effect of other factors, such as topography in mountainous regions, may cause abrupt variations of the in-situ stresses (Zang & Stephansson, 2009). However, Morin and others (2006) concluded that the topography effect is primarily felt near (within 100 m) steep slopes.
Case studies have demonstrated that the aperture of fractures can be influenced by the current in-situ tectonic stresses (Banks et al., 1994; Barton et al., 1995; Ferril et al., 1999; Morin & Savage, 2003; Morin et al., 2006; DesRoches et al., 2014). The results of some of the case studies are briefly described in Section 4.3. Furthermore, the relationship between reactivation by shear and increased fracture transmissivity is illustrated by a laboratory experiment described in Box 1 Effects of Shear Displacement on the Transmissivity of a Rock Fracture.
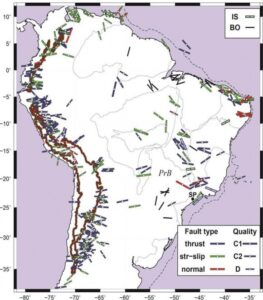
Figure 60 – SHmax estimates in South America based on focal mechanisms (seismic data from faults) as well as in-situ (IS) and borehole (BO) breakout measurements (from Assumpção et al., 2016; updated by Marcelo Assumpção in 2020). C1, C2 and D, as well as the size of the respective bars, express the quality and reliability of data, from the most to the least reliable.