Box 2 Lineament Extraction for Hydrogeologic Applications
The method of lineament interpretation has been used for a long time as a tool to select places for well drilling in fractured media. The criterion used is to drill the well as close as possible to at least one lineament. This is justified because a positive correlation between well production and lineaments has been identified in several places and by several authors (e.g., Parizek & Gold, 1993; Fernandes & Rudolph, 2001; Akinluyi et al., 2018). The premise of this application is based on the following: the circulation of water in fractured aquifers is linked to secondary porosity (fractures) and lineaments are often the surface expression of fracture zones (Figure Box 2-1). Therefore, drilling wells along or close to these features should increase the chance of obtaining larger water production.
The most accepted definition of a lineament is provided by O’Leary and others (1976), who consider that lineaments are geomorphological linear features on the terrain surface, which are mappable and presumably reflect subsurface geological structure that is expressed as straight segments on the ground surface. The linear features do not necessarily correspond to fractures and this limitation should be taken under consideration.
A second possible application of lineament extraction is to identify the structural trends dominant in a region, aiming to identify their spatial variability from one area to another and thus the limits of structural domains. This application can be key to the study of the fracture network configuration and the establishment of conceptual flow models in fractured aquifers.
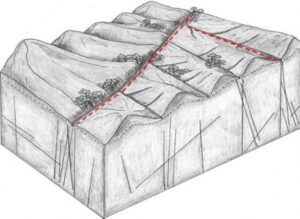
Figure Box 2-1 – A lineament is a geomorphological linear feature on the terrain surface that presumably reflects subsurface geological structures. Lineaments are associated with straight stretches of rivers (some are highlighted by red dashed lines) and are the expression of fracture zones.
Box 2.1 Constraints on Lineament Interpretation
In order to take the most advantage of lineament interpretation, it is necessary to keep the following in mind:
- rectilinear morphological features can represent structures that often are not permeable;
- the geometric properties of fractures (aperture, density, dip) manifested as lineaments are highly variable;
- a large amount of subjectivity is involved in the task of identifying lineaments and procedures must be adopted to reduce this subjectivity;
- factors such as relief and thickness of the soil can significantly influence the extent and success of the application of lineament analysis; and,
- the representativeness and usefulness of a lineament map for evaluating fracture networks depends on the configuration of the fracture network.
- These issues are briefly discussed in this box.
Box 2.2 Rectilinear Morphological Features
Lineaments can represent several types of planar structures that do not contain voids or support groundwater flow. These structures can be mylonitic shear zones, contacts between different lithologies, foliations, dikes, layers or veins of more resistant materials (e.g., quartzites). Gleeson & Novakowski (2009), for example, demonstrated that, in a specific crystalline rock setting of the Canadian Shield, the bedrock underlying lineaments is composed of poorly connected zones due to the presence of reduced permeability materials produced by fault processes. These authors suggest that the lineaments are mainly the expression of barriers to recharge and flow. Thus, in order to perform an adequate lineament interpretation, it is necessary to have a prior knowledge of the components that comprise the structural framework of a region. This knowledge must preferably come from detailed geological maps, which will enable a more realistic and reliable categorization of lineaments. The categorization is useful, for example, to make a distinction between lineaments associated with ridges and the ones associated with valleys. The former are frequently linked with rocks more resistant to erosion, such as dikes, veins, and mylonites, which by themselves do not carry groundwater and may represent barriers to flow.
Box 2.3 Geometric Properties of the Fractures
Brittle structures manifested as lineaments have variable geometric properties. Connectivity, persistence (Figure Box 2-2), thickness and fracture density, either of a joint zone or a fault zone, are all variable and, as a consequence, one well located close to a lineament may intercept a variety of fractures with variable transmissivities. In general, a small percentage of fractures provide most of the groundwater flow. Another important geometric characteristic is the dip of a fracture zone; whenever possible it should be known in order to successfully intersect it when locating a well (Figure Box 2-3).
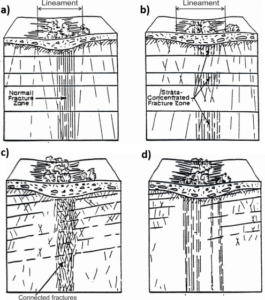
Figure Box 2-2 – Lineaments are frequently expressed by straight stretches of rivers, brooks or ephemeral water streams. They can be related to several types of fracture zones as depicted in these sketches. (Parizek & Gold 1993). a) Single fracture zone of vertical, non-connected, and some throughgoing fractures. b) Discontinuous fracture zone of mostly bed-confined fractures. c) Fracture zone of relatively short but well-connected fractures. d) A few fracture zones formed by parallel non-connected fractures.
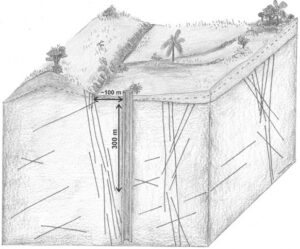
Figure Box 2-3 – For a fracture zone that dips around 75o and a borehole that is 300 m deep, the maximum distance at which this zone will be intercepted by the well is around 100 m. At the scale of 1:25,000, 100 m corresponds to 4 mm on the terrain image or map. So, when it comes to selecting a place to drill a well, it is recommended that scales of around 1:25,000, or with a higher resolution, be used in order to precisely select the well location with regard to a lineament. On the right side of the image, the sedimentary cover, even though quite thin, precludes the expression of bedrock fracture zones as lineaments.
Box 2.4 Scale of Lineament Extraction
The scale of lineament extraction allowed by the type and resolution of the source material (i.e., satellite image, aerial photograph, or digital elevation model) is a key factor in the value of lineament analysis for a given application. When it comes to selecting locations to drill wells, it is necessary to have an accuracy of a few tens of meters in order to ensure that the well is drilled close to the lineament. Thus, scales greater than 1:25,000 (1 cm = 250 m) are recommended. Figure Box 2-3 and Figure Box 2-4 illustrate this issue. Figure Box 2-3 also shows the importance of knowing the dip of the fracture zone so that the drilled well intersects it along its subsurface trajectory.
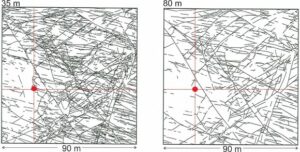
Figure Box 2-4 – The lines shown in the two sketches are actual fracture traces (or lineaments) extracted from photographs taken at heights of 35 m and 80 m above the terrain surface in Norway (Odling, 1997). In this area there is no soil or sediment cover, and the bedrock is directly visible. The different heights at which the photographs were taken render different resolutions, and this strongly influences the number of lines that are identified. The red dot represents a well that has the same location on both maps. In the sketch of higher resolution (height = 35 m), the well is at the intersection of fracture traces. However, in the smaller resolution sketch (height = 80 m), no trace is seen at the well location.
Box 2.5 Subjectivity of Lineament Interpretation
Lineament extraction involves a great deal of subjectivity; this has already been recognized by everyone who dedicated themselves to this endeavor. A way of overcoming this drawback is for the data extraction to be separately conducted by two or three people and, afterwards, for a consolidation of the results to be carried out. Mabee and others (1994) showed that this procedure yields more reliable results. Some authors recommend automatic extraction, but this faces the great difficulty that features such as roads and rural property limits end up being falsely traced as lineaments. So, no matter how good the automatic outcome is, a non-automatic screening of the extracted lineaments will always be required. When it comes to locating wells, the target areas are usually quite small, and it is likely that manual extraction performed by a few people provides the best cost-benefit relationship.
Box 2.6 Rugged Topography
Rugged topography has a significant influence on the surface expression of joint and fault zones. This is because the more intense erosion, that takes place in rugged terrains, favor the appearance of geological structures in the form of linear features on the ground surface. On the other hand, the presence of sediments covering fractured rock masses may hinder the appearance of lineaments (Figure Box 2-3). Thus, lineament maps tend to be more representative of the fracture trends in areas that are devoid of sediment cover and that experience more intense erosive processes.
Box 2.7 Lineament Map Representativeness
The extraction of lineaments carries an intrinsic sampling bias because they are, in general, the surface expression of steeply dipping fractures. Depending on the relief ruggedness, shallower dipping fractures, say less than 60°, will tend not to appear as lineaments on the surface and, therefore, a map of lineaments will not be representative of the entire fracture network. In addition, production wells are vertical thus mostly intercept fractures of low dip. A side consequence of wells being vertical is that their profiles do not provide representative estimates of the density of the high dip fractures. Thus, the assessment of the scope and reach of the lineament tracing method in a region must be based on the knowledge of the fracture network configuration, and this is achieved through rock exposure surveys.
The fracture configuration depends, to a large extent, on the rock types that constitute a given region (as described in Section 4.1). For example, in a region of flood basalts Fernandes and others (2007) concluded that the lack of correlation between the production rate of wells and lineaments was caused by the fact that the preferential groundwater flow paths in the basalts were subhorizontal fractures and these did not appear as lineaments on the terrain surface. Thus, even if some vertical fractures influence the production of the wells, this effect can be easily obscured by the greater influence of the subhorizontal fractures. Other authors (e.g., Parizek & Gold, 1993; Fernandes & Rudolph, 2001; Akinluyi et al., 2018) reported a positive correlation between the production of wells and lineaments in crystalline rocks, such as granite, gneiss, and schist, thereby reinforcing the idea that high dip fractures likely have a positive influence in those geological settings as illustrated in Figure Box 2-5. However, Mabee (1999) points out that a set of factors, including proximity to lineaments, that explain the production of wells in one region are not necessarily relevant in another.
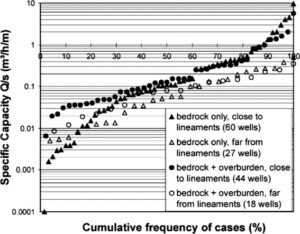
Figure Box 2-5 – In a granitic-gneissic bedrock, the specific capacity is larger for wells located close to lineaments (solid circles and triangles). The median specific capacity of wells near lineaments exceeds 0.1 m3/h/m. Above the cumulative frequency of 60 percent, the difference between productivity of wells near to (solid markers) and far from lineaments (open markers) increases. The presence of overburden (both open and solid circles) influences only the wells with smaller specific capacities, as shown by the difference in productivity indicated by solid versus open circles and the difference between solid and open triangles on the left side of the graph (Fernandes & Rudolph, 2001).
Box 2.8 Recommendations
Given the above considerations, it is evident that although lineament analysis may be helpful, information on the configuration of the fracture network gleaned from bibliographic and/or field data is essential for evaluating the effectiveness of the method.
Although there are significant limitations, as mentioned above, this technique is inexpensive and may be of benefit to increase the chances of drilling higher-yield wells. This is especially important to communities that are threatened by water shortages and that do not have the resources to use more sophisticated methods.
Vulnerable regions, such as the ones in Africa, India, and northeastern Brazil, are largely made up of crystalline fractured aquifers. In addition, many of these regions have a drier climate, in which case analyzing the relationship between vegetation and lineaments may be a good strategy. For example, Gustafsson (1994) showed that the lineaments that maintain green vegetation at the end of the dry season could indicate the location of
fractures that are good groundwater conduits. Lineaments holding vegetation during the dry season were also reported by Corgne and others (2010).
The location of wells close to at least one lineament is considered a good criterion for increasing the chance of obtaining significant yields (e.g., Parizek & Gold, 1993). This is justified because intercepting fractures of different orientations increases the chance of crosscutting more permeable fractures.
The reduction of subjectivity involved in the method and the selection of sources that provide a proper scale are key aspects to successful application of lineament analysis. Unlike a few decades ago, when only aerial photographs and small-scale satellite images (e.g., 1:100,000) were available, there is now a wide range of available materials and digital elevation models are among the best (Figure Box 2-6 and Figure Box 2-7).
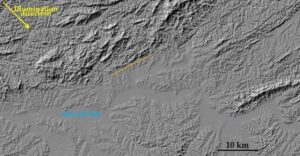
Figure Box 2-6 – Shaded relief image from a digital surface model (DSM) (Zhou, 2016) showing a portion of the Metropolitan Region of São Paulo (Brazil) consisting of crystalline Precambrian rocks, covered in the central area by Tertiary and alluvial sediments (flat areas). This is a regional scale DSM (EMPLASA, 2010; Datageo, 2021) with a resolution compatible with the scale of ~1:60,000. In this image, the illumination comes from Northwest (N45W), so that the darkest shadows mostly highlight the NE lineaments (dashed orange line is an example). This DSM could be used to identify regional structural trends; however, it does not allow the estimation of the proximity of wells to lineaments.
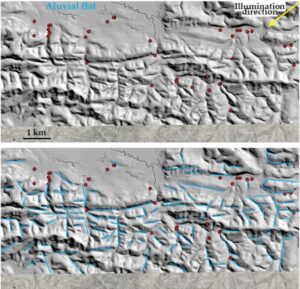
Figure Box 2-7 – Shaded relief image from a digital elevation model (DEM) produced from a 1:10,000 topographic map (the bottom has altitude contours). This renders a resolution compatible with a scale between 1:10,000 and 1:25,000. Small drainages and water divides (top of rolling hills) are shown. The illumination comes from northeast (N45E). Lineaments (blue lines) are shown on the bottom image; noticeable ~EW- trending lineaments indicate that structures in this direction are very important in this area. The red dots show the location of existing wells. The DEM resolution is large enough to allow the estimation of the proximity of the wells to lineaments; this can be used to investigate, for example, the influence of proximity and direction of lineaments on well production. The definition and sources of DSM and DEM data can be found in, for example, Mukherjee and others (2013) and Zhou (2016).
For the successful application of the lineament method, it is essential to gather and build specific knowledge not only on the structural elements of a particular region, but also of the rock types and soil thickness.
The method of tracing lineaments has at least three types of applications:
-
selection of locations for drilling wells;
-
study of the relationships between hydraulic properties and brittle structures (e.g., Gleeson & Novakowski, 2009); and,
-
identification of the main structural trends as a first approach for delimiting hydrostructural domains.
In the first two cases, it is essential to make a very detailed and precise lineament extraction using materials that have an appropriate resolution. For the third case, the definition of the appropriate scale required to identify fracture trends and structural domains depends on the size of the domain being studied.
In the case of delimiting hydrostructural domains, exhaustive lineament extraction is not mandatory, the resulting lineament map only needs to be representative of the structural trends. The use of lineament extraction for mapping the limits of structural domains has been explored to some extent by Fernandes & Rudolph (2001). The authors showed that in areas with a certain pattern of lineament trends, wells near NW lineaments were more productive, whereas in areas with another pattern, wells in NNE lineaments were more productive. Furthermore, Fiume and others (2020) compared regional and local lineament patterns to evaluate whether fracture data from outcrops could be extrapolated to a site where no outcrops were available; at this site the survey of fracture data was conducted through scanlines along well optical televiewer (OPTV) images. The authors concluded that most of the fracture sets from both outcrop and well data were similar. The regional and local lineaments extracted from small- and large-scale sources, respectively, also showed similar trends.
The overall conclusion is that, if appropriate scales are used and care is taken to reduce the intrinsic subjectivities of this method, lineament extraction can and should be used as a preliminary structural characterization tool for various applications in hydrogeology. However, it is essential to recognize its inherent limitations such as the sampling bias related to the non-detection of low dip fractures, the type of relief and the presence of sediment cover.
Box 2.9 References
Akinluyi, F.O., M.O. Olorunfemi, & O.G. Bayowa, 2018, Investigation of the influence of lineaments, lineament intersections and geology on groundwater yield in the basement complex terrain of Ondo State, Southwestern Nigeria. Applied Water Science, volume 8, issue 49, pages 1-13, doi: 10.1007/s13201-018-0686-x.
Corgne, S., R. Magagi, M. Yergeau, & D. Sylla, 2010, An integrated approach to hydrogeological lineament mapping of a semi-arid region of West Africa using Radarsat-1 and GIS. Remote Sensing of Environment, volume 114, issue 9, pages 1863-1875, doi: 10.1016/j.rse.2010.03.004.
DATAGEO, 2021, Environmental Spatial Data Infrastructure of the State of São Paulo, Digital Surface Model of the State of São Paulo, datageo.ambiente.sp.gov.br (in Portuguese).
EMPLASA, 2010, São Paulo Metropolitan Planning Company, Digital Surface Model of the State of São Paulo, Mapeia São Paulo Project, São Paulo, Brazil, Link to EMPLASA (in Portuguese).
Fernandes, A.J., M.M. Perrotta, E.D. Salvador, S.G. Azevedo, A. Gimenez Filho, & N. Paulon, 2007, Potential of fractured aquifers in the state of São Paulo: geological constraints. Ground Waters, volume 21, issue 1, pages 65-84, doi: 10.14295/ras.v21i1.16168 (in Portuguese).
Fernandes, A.J. & D. Rudolph, 2001, The influence of Cenozoic tectonics on the groundwater-production capacity of fractured zones: a case study in São Paulo, Brazil. Hydrogeology Journal, volume 9, issue 2, pages 151-167, doi: 10.1007/s100400000103.
Fiume, B., A.J. Fernandes, M.B. Barbosa, R. Hirata, & R.A. Bertolo, 2020, Integrated application of geophysical loggings and fracture survey on rock exposures for identifying transmissive fractures in crystalline aquifer: case study in the city of São Paulo. Brazilian Journal of Geology, volume 50, issue 1, 17 pages, doi: 10.1590/2317-4889202020190034.
Gleeson, T. and K. Novakowski, 2009, Identifying watershed-scale barriers to groundwater flow: lineaments in the Canadian Shield. Geological Society of America Bulletin, volume 121, issues 3-4, pages 333-347, doi: 10.1130/B26241.1.
Gustafsson, P., 1994, Spot satellite data for exploration of fractured aquifers in a semi-arid area in Southeastern Botswana. Applied Hydrogeology, volume 2, issue 2, pages 9-18, doi: 10.1007/s100400050246.
Mabee, S.B., 1999, Factors influencing well productivity in glaciated metamorphic rocks. Groundwater, volume 37, issue 1, pages 88-97, doi: 10.1111/j.1745-6584.1999.tb00961.x.
Mabee, S.B; C.H. Hardcastle, & D.U. Wise, 1994, A method of collecting and analyzing lineaments for regional scale fractured-bedrock aquifer studies. Groundwater, volume 32, issue 6, pages 884-894, doi: 10.1111/j.1745-6584.1994.tb00928.x.
Mukherjee, S., P.K. Joshi, S. Mukherjee, A. Ghosh, R.D. Garg, & A. Mukhopadhyay, 2013, Evaluation of vertical accuracy of open-source Digital Elevation Model (DEM). International Journal of Applied Earth Observation and Geoinformation, volume 21, pages 205-217, doi: 10.1016/j.jag.2012.09.004.
Odling, N. E., 1997, Scaling and connectivity of joint systems in sandstones from western Norway. Journal of Structural Geology, volume 19, issue 10, pages 1257-1271, doi: 10.1016/S0191-8141(97)00041-2.
O’Leary, D.W., J.D. Friedman, & H.A. Pohn, 1976, Lineament, linear, lineation: some proposed new standards for old terms. Geological Society American Bulletin, volume 87, issue 10, pages 1463-1469, doi: 10.1130/0016-7606(1976)87%3C1463:LLLSPN%3E2.0.CO;2.
Parizek, R. & D. Gold, 1993, Fracture trace and lineament analysis. Pennsylvania State University, Course Notes, 91 pages.
Zhou, Q., 2016, Digital elevation model and digital surface model in International Encyclopedia of Geography: People, the Earth, Environment and Technology, pages 1-17, [doi: 10.1002/9781118786352.wbieg0768](https://doi.org/10.1002