7 Glossary
Layer of compact (without vesicles) columnar basalt in which the column sections are decimeters in diameter. This layer is usually located at the base of the basalt flood. Due to the cooling front, columns are usually roughly perpendicular to the basalt contacts, resulting in the existence of either vertical or inclined columns.
Narrow zone of deformation that typically occurs in highly porous granular media, notably porous sandstones. There are several types of deformation bands in which shear, dilation and compaction bands are the end-members.
Deformation in which the rock “flows” and originally continuous structures (e.g., rock contacts and veins) remain continuous after the deformation. Foliation is a typical result of ductile deformation and consists of a planar structure formed by mineral orientation.
Layer of compact fractured basalt in which the closely spaced cooling joints either are chaotic or form irregular and small diameter (a maximum of 10 to 20 cm) vertical columns. The entablature layer is usually located above a colonnade layer in a basalt flood. In the colonnade layer the cooling joints form regular and larger diameter (several tens of centimeters) vertical columns.
The line that is obtained through the connection of points, representing specific combinations of shear and normal stresses that cause fractures to be generated. It is determined through laboratory experiments and describes the stress conditions at failure for a given rock.
A series of closely spaced and subparallel faults that clearly form a cluster in a given rock mass. The width of the zone ranges from centimeters or meters, as observed at the scale of rock exposures in the field, to a kilometer or more for large-scale faults such as the San Andreas Fault.
The full description of a fracture orientation, also called fracture attitude, includes the compass directions of its strike and dip direction, as well the angle of dip. The angle that a horizontal line within the fracture plane makes with north is the strike direction. The angle between the horizontal plane and the line defining the maximum dip of the fracture plane is the dip value; it is measured down from horizontal. The following image is a stereographic projection that illustrates these items among others.
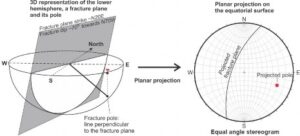
The stereographic projection is a planar plot of the intersections of planes and lines with the outer limit of the lower hemisphere on the equator surface of the same sphere (based on Johnson et al., 2002b).
A fracture is said to be persistent, or continuous, when its trace length on a surface exposure of rock is long, usually tens of meters or more.
Fractures that have a similar orientation, appearing as clusters in a stereogram (defined in this glossary under stereographic projection). The limit of a fracture set on a stereogram usually corresponds to a sharp decrease in the number of poles of that given set. In the stereogram shown here, each color represents a different fracture set.
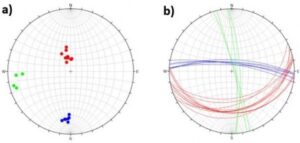
Three fracture sets, represented by different colors, appearing as clusters in a stereogram. A) Stereogram – fracture poles. Each dot is the projection of a line perpendicular to the fracture plane. B) Stereogram – fracture great circles. Each arc (great circle) is the projection of a fracture plane.
A series of subparallel fractures (belonging to the same fracture set) that are close enough to each other to define a zone. The fracture spacing in the zone is distinctly smaller than the spacing of the same set outside the zone.
Fluid that remains after rock crystallization, from which they originated, and that percolate through the same rock, eventually forming veins and/or causing hydrothermal alteration.
The adjustment of the lithosphere of the Earth to maintain equilibrium among units of varying mass and density; excess mass above sea level (e.g., large mountain ranges) is balanced by a deficit of density below sea level, and vice versa (Mindat, 2022). The isostatic compensation gives rise to some areas that are experiencing uplift and others that are undergoing subsidence.
Maximum Horizontal Stress – SHmax
The maximum horizontal stress acting on a region, whose direction is usually deduced from seismicity data and borehole breakouts. For the compressive and strike-slip tectonic regimes, SHmax represents σ1 and for the extensional regime, it represents σ2.
Circle in the Mohr diagram that depicts the normal and shear stresses acting on planes having all possible orientations in a rock body. These orientations are represented by points in the circle.
Diagram where the horizontal and vertical axes represent the normal (σn) and shear (τ) stresses that act on planes in a rock mass.
Rock displaying a distinctive foliation and grain size reduction that was formed by intense ductile deformation in shear zones. In the progression of mylonitic rock development, grain size reduction may be accompanied by some degree of recrystallization.
Permeability that is provided by pores that are formed along with the processes that form the rock itself, for example the voids between the granular clasts of sedimentary rocks.
The host rock, with its structures and textures, prior to the deformation being considered.
Tabular zone typically dominated by shear and ductile deformation.
Finely polished fault surfaces formed by grain crushing during the sliding/shearing movement of a fault.
Planar plot of the intersections of planes and lines with the outer limit of a lower hemisphere on the equator surface of the same sphere. Planes (e.g., fracture, foliation) will appear as arcs, called great circles. Besides the great circles, planes can also be represented by their poles, which are normal (perpendicular) to the planes and appear as points. The result is a stereogram that is used to analyze the spatial distribution of geological structures. This is shown in the following three-dimensional image and stereogram, which in this case illustrates a fracture plane with a strike of N20E and dip of 70° toward the NW.
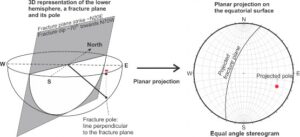
A stereographic projection is a planar plot of the intersection of planes and lines with the outer limit of the lower hemisphere on the equator surface of the same sphere (based on Johnson et al., 2002b).
Parallel lines on the fault surfaces expressed by scratches and grooves. They are produced by the friction of small, hard particles sliding over the fault surfaces. Small steps, approximately perpendicular to the striae lineation, are often observed and are used for deducing the relative movement of the fault surfaces.
Tectonic Event (Deformation Phase)
A time period during which structures form continuously within an area or region in response to a specific stress orientation and tectonic regime that remains relatively unchanged.
A measure of the potential of an aquifer to produce water based on the hydraulic conductivity and the thickness of the aquifer. In fractured aquifers, transmissivity is measured through a hydraulic test that isolates a certain depth interval of the rock mass containing one or more fractures. Transmissivity has dimensions of (L2/T) and is commonly expressed in units of m2/s.