3.2 Permeability
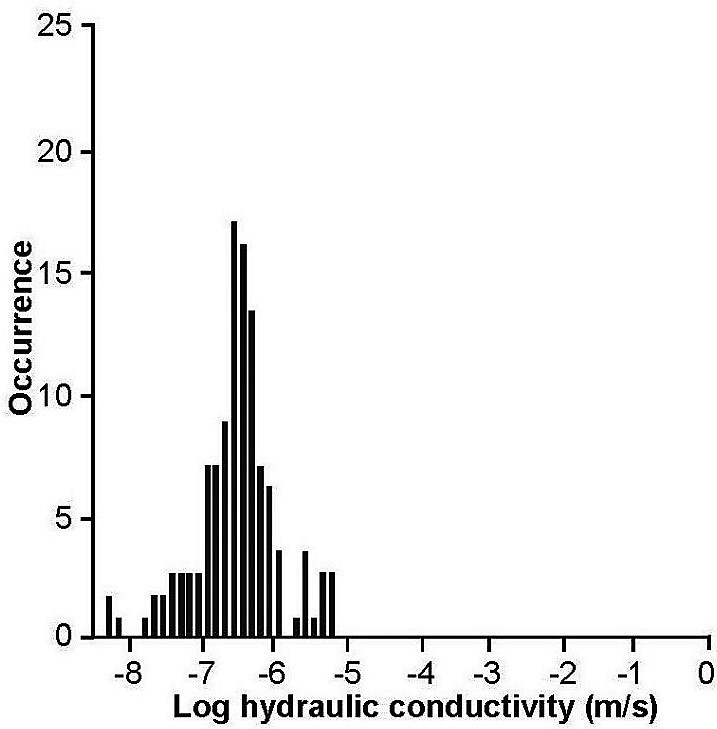
Similar to porosity, there are three sets of permeability3: matrix, fractures, and conduits (Halihan et al., 2000; Hovorka et al., 2004; Worthington 2004). Hovorka and others (1998) compiled the, then existing, hydraulic conductivity data (Figure 18). The median hydraulic conductivity estimated from 680 specific capacity tests was approximately 3.5×10⁻⁵ m/sec (10 feet/day) but ranged over eight orders of magnitude. A few specific capacity tests reported zero drawdown reflecting extremely high permeability and were assigned small (minimal) drawdowns in order to calculate a permeability value. Matrix hydraulic conductivity from core plugs is shown in Figure 19. Median hydraulic conductivities of matrix core plugs were two orders of magnitude less than those calculated from specific capacity data, which shows that secondary porosity (fractures and karstic features) controls well yields.

Figure 18 – Hydraulic conductivity for the Edwards Aquifer based on specific capacity data (modified from Hovorka et al., 1998). 1 m/sec = 2.83105 ft/day = 1.15×10⁻⁷ m2.

Figure 19 – Matrix hydraulic conductivity for the Edwards Aquifer based on core plug data (modified from Hovorka et al., 1998).
Halihan and others (1999) compiled permeability data from Hovorka and others (1993, 1995, and 1998), Mace (1997), and regional models (Klemt et al., 1979; Maclay and Land, 1988; Thorkildsen and McElhaney, 1992) to show permeabilities for the matrix (small-scale), wells (well-scale), and karstic conduits (regional scale). The data from well-scale (1,072 tests) and small-scale (493 tests) permeability tests approach log-normal distributions as indicated by the nearly straight line they form in Figure 20. The regional-scale permeabilities inferred from the numerical models are consistent with conduit flow.

Figure 20 – Permeability scale effect for the San Antonio segment (after Halihan et al., 1999, 2000; Hovorka et al., 1993 and 1995). The three, regional-scale studies (Klemt et al., 1979; Maclay and Land, 1988; Thorkildsen and McElhaney, 1992) each estimated ranges of permeability. Permeability ranges for limestone, gravel, and karst (modified from Freeze and Cherry, 1979, page 29) are illustrated in boxes on the right for comparison. The cumulative-distribution function of a normal (i.e., Gaussian) distribution plots as a straight line on the probability scale, which is shown as percent on the horizontal axis. The cumulative-distribution function of the log permeability of the test data form a nearly straight line indicating they are nearly log-normally distributed. It is common for permeability of geologic formations to be log-normally distributed (e.g., Figure 18 and Figure 19).
Halihan and others (1999) showed that the well-scale permeability distribution for this set of data could be replicated by 50 Monte Carlo realizations of fracture models using the cubic law and fracture aperture spacing data from Hovorka and others (1998). The regional-scale model permeability values were intermediate between those reflecting laminar conduit flow (greater than the regional-scale values) and fully turbulent conduit flow (less than the regional-scale values) as shown in Figure 21. Regional conduit flow is best modeled as turbulent, but is highly dependent on the local conduit geometry.

Figure 21 – Modeled permeabilities for Edwards Aquifer matrix (red), fractures (orange), and conduits (blue) compared to data (black) from Figure 20 (after Halihan et al., 1999, 2000). Permeability ranges for the matrix, fractures, and for laminar and turbulent flow in conduits were calculated based on Gupta (1989) and Halihan and others (1999) from 493 core plugs and roadcut measurements of 776 fracture apertures and 2785 conduit diameters (Hovorka et al., 1998).
3Permeability (k, units of L2) is a function of pore geometry, and describes the ease with which a medium can transmit fluid. It is related to hydraulic conductivity (K, units of LT–1) as defined by Darcy’s Law which describes the volumetric flow rate under a given hydraulic gradient by combining k with the fluid density and viscosity.
