3.3 Residence Times
Calculating groundwater residence times in karst aquifers is challenging due to the variable mixture of young conduit flow water and potentially much older matrix water. In light of this limitation, groundwater residence times for the Edwards Aquifer have been calculated by numerical model simulations, isotopic age dating, and tracer tests. Residence times are relatively short in the aquifer but increase downdip into the brackish water zones (the bad-water zone) as described by Hunt and others (2019). In the freshwater zone, both confined and unconfined, water is recent with inferred ages ranging from days to a few thousand years. Musgrove and others (2019b) estimate mean groundwater ages ranging from 7 to > 700 years. This large range in residence times is also observed in spring discharge, which is expected because of the three sets of permeability.
For a given hydraulic gradient, flow rates can be expected to vary by orders of magnitude in the conduits, fractures, and matrix. The shortest residence times are found in the recharge zone where there is discrete recharge or along conduit flow paths (with the fastest groundwater flow velocities). Tracer testing is the best method for measuring the quickest rates of flow from a recharge feature to wells or springs. Traditional groundwater models may have difficulty estimating travel times in karst aquifers with well-developed conduit networks (Worthington et al., 2002; Smith et al., 2005b). Apparent ages in the bad-water zone are much older and it can be inferred that the ages of waters with total dissolved solids (TDS) over 4,000 mg/L are on the order of 20,000 years. Waters farther down dip in the Gulf of Mexico sedimentary basin are inferred to be still older (Sharp and Smith, 2019; Hoff and Dutton, 2017; Darling, 2016; Land and Prezbindowski, 1981).
Traditional groundwater models are poor tools for estimating travel times in mature karst aquifers with well-developed conduit networks (Smith et al., 2005b). Based on model flow lines, Jagucki and others (2011) report that over 50 percent of the water from public-supply wells near San Antonio was less than two years old (Figure 22).
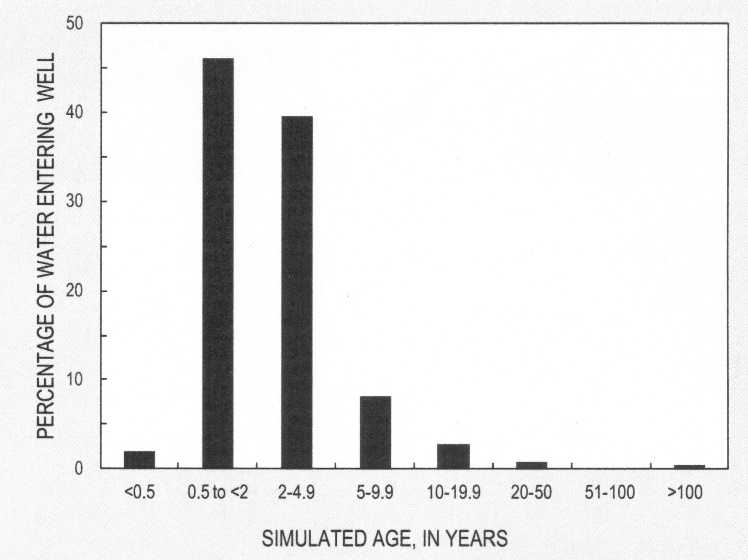
Figure 22 – Mix of water ages for a public supply well near San Antonio (Jagucki et al., 2011).
Lindgren and others (2011) used particle-tracking simulations to estimate travel times to 10 study wells. The simulated particle ages ranged from less than one day to more than 1,900 years. Their modeled particle ages for models calibrated to the observed tritium data gave residence times ranging from 2.5 to 15 years for the shallower and deeper wells, respectively.
Kuniansky and others (2001, Table 1 therein) used head data from 1978 to 1979 to calculate ranges of travel times for flow from recharge areas near the Edwards Plateau to San Marcos and Comal springs. The shortest estimate was from 14 to 160 years for a flow path from the Blanco River to San Marcos Springs and the longest was 350 to 4,300 years for a hypothetical flow path from the West Nueces River to Comal Springs. The models used matrix porosity values averaging 22 to 26 percent. If fracture porosity/permeability values had been used, the calculated travel times would have been shorter. In addition, these travel times were calculated with a porous-media model. Travel times calculated with a model that represented preferential flow paths would be shorter.
3.3.1 Isotopic Ages
Tritium (3H or T), 14C, and 3He isotopes have been used to infer groundwater age in the Edwards Aquifer. Campana and Mahin (1985) used a discrete-state computer model and tritium data to estimate mean ages for water in the confined zone of the San Antonio segment. The mean groundwater ages ranged from 16 to 132 years. Since the decay of the 1963 tritium bomb pulse has become significant, the use of tritium in dating groundwater has become more difficult. Nonetheless, the presence of tritium indicates relatively young groundwater. Darling (2016) plotted 25 samples of water analyses of Edwards Aquifer waters that had both 14C and T data. Recently recharged (“young”) waters would have higher levels of T (in tritium units) and percent modern carbon (pmc, percent modern 14C) with the understanding that both isotopes decay, but at different rates. The linear regression between T and pmc is T = 2.50 – (100 percent – 3.47 pmc)/100. The data show mixing of young and older waters. If the pmc is less than 35 percent, then mixing cannot be calculated because the tritium is essentially gone.
14C dating is complicated because the dissolution of carbonate minerals in the aquifer contributes dead (nonradiogenic) 13C. Thus, pmc decreases because of both radioactive decay and the introduction of dead C so that precise age dating is not possible. However, some general trends can still be discerned. Maclay and others (1980) provided a review of hydrochemical data for the San Antonio region, including samples from the brackish-water zone. For five waters with over 4,000 mg/L TDS, the apparent age dates were all over 26,000 years before present; a water with 1,220 to 1,280 mg/L gave an apparent age date of 12,000 years before present. These ages are consistent with the origin of the brackish waters in this area, which are upwelling from the Gulf of Mexico Basin (Sharp and Clement, 1988; Hoff and Dutton, 2017).
Tritium (3H), 14C, and 3He were used by Hunt and others (2016) to infer groundwater ages in the Uvalde pool. These ages ranged from less than 2 years in the recharge zone to over 26 years in the vicinity of the brackish-water line and to the east in the direction of the regional flow. Many of their apparent ages showed mixing of modern (< 60 years old) and premodern waters. Mixing was most evident when waters approached 1,000 mg/L but mixing was also inferred in the unconfined zone based on excess helium concentration anomalies, which are consistent with subsurface discharge of premodern groundwater from the underlying Trinity Aquifer into the younger groundwater of the Edwards Aquifer. Recent work by Musgrove and others (2019a,b) is consistent with the age ranges of these other studies (< 10 to > 700 years). Water in the San Antonio pool confined zone is a mix of older and younger waters (with the young ages between 24 to 30 years and the older ages variable depending on the depth/location in the aquifer). These ages and mixtures are consistent with rapid recharge, rapid flow in the karst aquifer that is attested to by tracer tests, the triple porosity (matrix, fracture, conduit) aquifer system, and inflows of older water from underlying and downdip units.
3.3.2 Tracer Tests
Johnson and others (2019) reviewed tracer test results for the Edwards Aquifer. These test results showed very high flow velocities. In the Barton Springs segment, tracer tests delineated flow paths in separate pools (groundwater basins). Groundwater velocities ranged from 915 to 9,150 m/day (Hauwert et al., 2004). Hunt and others (2019) reported flow rates of 110 to 4,931 m/day to Barton Springs. Water-chemistry data for Barton Springs indicate that discharge is a mix of waters from several different flow paths.
In the San Antonio segment, Rothermal and Ogden (1987) measured straight-line flow velocities of 640 m/day to Hueco Springs. Smith and others (2012) calculated straight-line velocities ranging from < 1 to 3,600 m/day to San Marcos and Barton springs. In Bexar County, tracer tests indicate that the Upper Trinity Aquifer was in direct hydraulic connection with the Edwards Aquifer. Tracers injected into the Trinity Aquifer traveled toward the Edwards Aquifer with straight-line tracer velocities ranging from 13 to 5,300 m/day (Johnson et al., 2010). In Kinney County, 13 tracer tests indicated slow to rapid (up to 1,350 m/day) groundwater velocities (Johnson and Schindel, 2015).