3.4 Water Chemistry
Water quality in the aquifer is generally excellent. Few contaminant concentrations ever exceed human health-based benchmarks (Bush et al., 2000; Lindsey et al., 2009; Tremallo et al., 2016; Smith et al., 2001, Musgrove et al., 2019b). The waters are less than 1000 mg/L total dissolved solids (TDS) and generally less than 500 mg/L (Figure 23), and are a calcium-magnesium-bicarbonate hydrochemical facies (e.g., Welder and Reeves, 1962; Guyton and Associates, 1979; Groschen, 1996; Hunt et al., 2019, Jones, 2019). A few wells show sulfate or chloride as the most common anion, but these are nearly always associated with the saline-water transition zone or have contributions from underlying aquifers. Nonetheless, detectable concentrations of contaminants indicate that anthropogenic activities on the land surface affect the aquifer (Bush et al., 2000; Jagucki et al., 2011; Mahler and Musgrove, 2019a). Despite intense utilization of the aquifer and urbanization over the recharge zone, water quality has remained good, mostly attributable to dilution due to high flow rates although a few wells show elevated levels of pathogens and nitrate. Urbanization and land cover are important factors affecting aquifer vulnerability (Opsahl et al., 2018). Leaks of sewage in the recharge zone have created local, short-lived E. coli contamination in wells and in Barton Springs (Mahler et al., 2011), which may be closed for several days after heavy rainfall events. Jagucki and others (2011) documented that pesticide compounds (atrazine, deethylatrazine, and simazine) and volatile organic compounds (tetrachloroethene [PCE], chloroform, bromoform, and dibromochloromethane) can occur in untreated water at concentrations “much less than established drinking–water standards, where such standards exist.” In the vicinity of the bad-water line, groundwater becomes brackish (> 1000 mg/L) to saline (> 10,000 mg/L) with naturally-occurring elevated levels of sodium, chloride, and sulfate (Figure 14 and Figure 23).
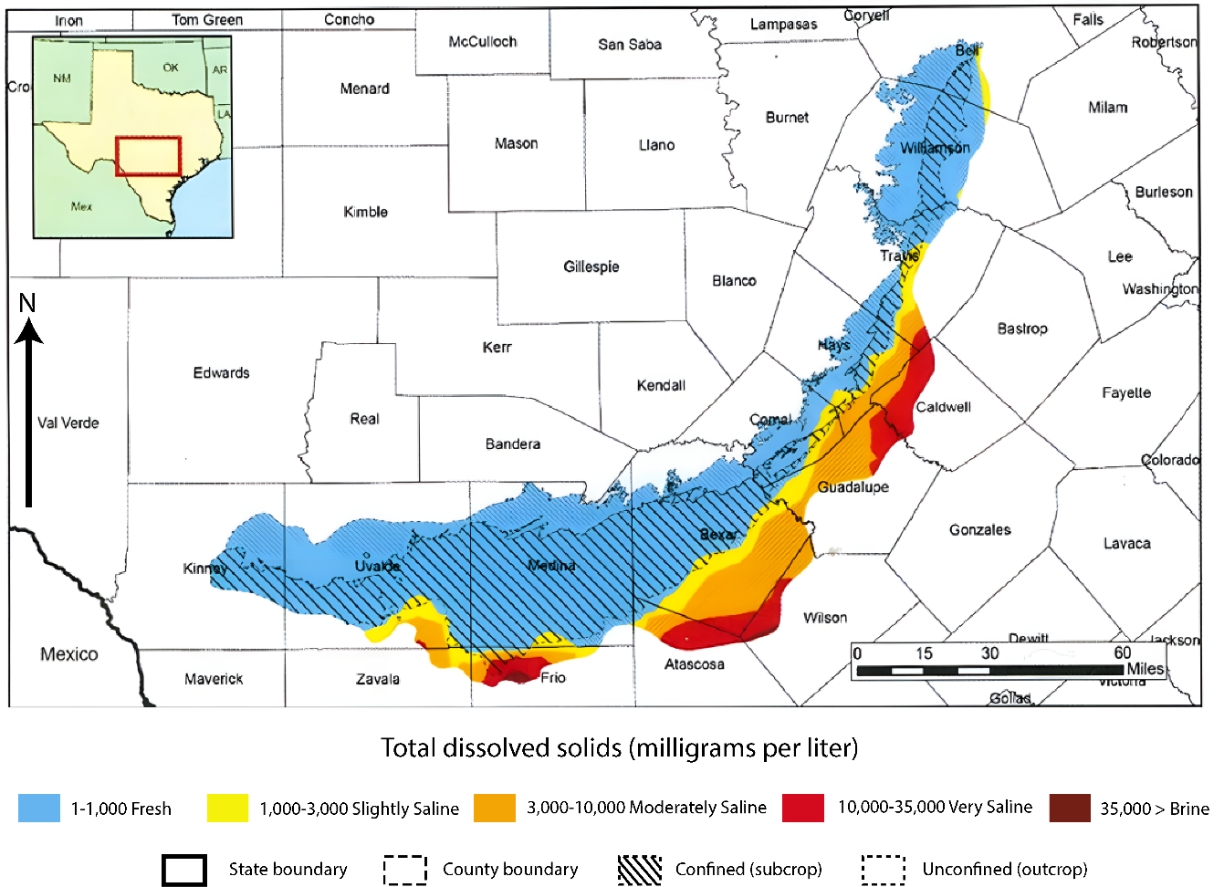
Figure 23 – Total dissolved solids in the Edwards Aquifer (modified from TWDB, 2016).
The bad-water zone has been relatively stable over time with six hydrochemical facies identified, which are created by different combinations of dissolution of evaporite and other minerals, mixing with basinal brines, dedolomitization, and cross-formational flow from underlying formations. The bad-water line on the maps approximates the 1000 mg/L isocon but is actually a transition zone (Figure 13). Flow in this zone is restricted, the waters are reducing, and recent studies (e.g., Engel, 2007; Abongwa and Den, 2021) suggest that microbes play important chemical and physical roles. However, the bad-water zone has sufficient water in storage and sufficient permeability so desalination or aquifer storage and recovery (ASR) could render it a viable water source option in the future (Smith et al., 2017).