1 Introduction
The Edwards Aquifer ranks among the world’s largest regional karst aquifers. It supplies 500 gigaliters/year (GL/year) of water (Mace, 2019) for over 2 million people and a wide variety of agricultural, municipal, industrial, environmental, and recreational uses in Texas, USA (Figure 1). Annual groundwater discharge is approximately 49 to 60 percent to springs, 27 to 32 percent to municipalities, 8 to 13 percent to irrigation, 3 to 4 percent for industrial/commercial uses, and 2 percent for domestic and livestock uses (e.g., EAA, 2008, 2019a). The exact proportions vary with precipitation, drought conditions, and other factors. In the literature and common parlance, the Edwards Aquifer or, more precisely, the Edwards (Balcones Fault Zone) Aquifer, refers to the units along the Balcones fault system in the Uvalde-San Antonio-Austin-Salado area which is a part of the Edwards Aquifer System (Figure 2). This book focusses on this aquifer, which extends from east of Del Rio on the USA-Mexico border east through San Antonio, then northeast through Austin and Salado. It covers an area of 5,993 km2 (2,314 square miles) of which 4,040 km2 (1,560 square miles) are outcrop. The aquifer is the northwestward extent of the Gulf Coastal Plain and is separated from the Edwards Plateau (Figure 2) and the Texas Hill country by the Balcones Escarpment.
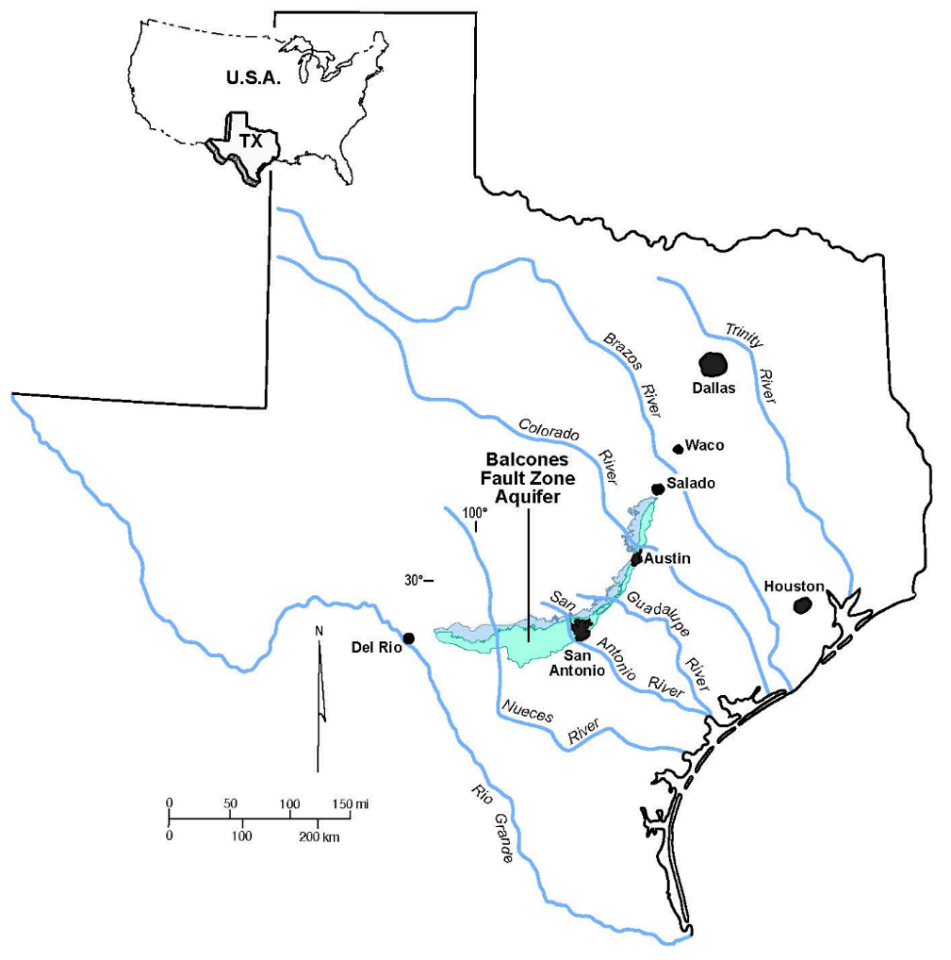
Figure 1 – The Edwards Aquifer of Texas, USA (Balcones Fault Zone). The blue color is the unconfined or recharge zone and the light blue-green color is the confined or artesian zone, both zones are shown in Figure 2 at a larger scale.

Figure 2 – Map of the Edwards Aquifer strata: Balcones Fault Zone (BFZ); Edwards-Trinity Plateau; Rio Grande System; and, Washita Prairies (modified from Sharp et al., 2019b). Aquifer-equivalent strata extend down dip toward the Gulf of Mexico and into Mexico. Edwards equivalent strata beneath the High Plains of Texas are not shown here. Their location is presented by Mace (2019).
Mean annual temperature increases southward over the aquifer from 18 to 21 °C (Larkin and Bomar, 1983; TWDB, 2012). Mean annual precipitation over the aquifer north of San Antonio to Salado ranges between 800 and 920 mm/year (31 and 36 inches/year). From San Antonio westward, however, precipitation drops to 500 mm/year (20 inches/year). Likewise, annual precipitation varies considerably with extended droughts and occasional very large precipitation events (Slade and Patton, 2003; Henry, 2011). Thus, aquifer management must plan for and adjust to future extreme weather situations. Traditional land use was ranching with irrigated agriculture over the confined zone west of San Antonio with urban areas in Austin and San Antonio. Population growth of approximately 20 percent in the Austin-San Antonio corridor over the past ten years, has greatly expanded urbanization along the Interstate Highway 35 from San Antonio north to Salado, although urbanization has been somewhat limited in aquifer recharge areas by municipal zoning and land purchases (Guerra and Debbage, 2021).
Equivalent aquifer strata extend over a much larger area of the USA and into Mexico (Figure 2). North and west of the Balcones Fault Zone are the Edwards and Stockton Plateaus (Small and Ozuna, 1992; Kuniansky and Ardis, 2004). Aquifer strata also extend beneath the High Plains Aquifer (Fallin, 1989; TWDB, 2022) and north of the Balcones fault system in the Washita Prairies (Yelderman, 1987, 2019). These units can provide significant water to wells, but springs are generally not as large as springs along the Balcones Fault Zone (Figure 2). The formations that comprise the Edwards Aquifer also extend down dip to the Gulf of Mexico Basin and into Mexico (Rose, 1972, 2017; Sharp et al., 1991; Sprouse, 2009).
Prior to development in the area, springs were the major source of discharge from the aquifer and cities developed near them. Some of the major springs of the Edwards Aquifer are shown in Figure 3 through 11, starting from the westernmost to the northernmost, the spring and nearby town or landmark are as follows:
- Las Moras (or Fort Clark) Springs, Bracketville (Figure 3);
- San Antonio Springs at the head of the San Antonio River (Figure 4);
- Hueco Springs, Canyon Lake (Figure 5);
- Comal Spring 1, one of the Comal Springs, New Braunfels (Figure 6);
- Comal River, New Braunfels (combined flow of all Comal Springs, Figure 7);
- San Marcos Spring discharge, San Marcos (Figure 8);
- Main Barton Spring (one of the four Barton Springs), Austin (Figure 9);
- Eliza Spring (one of the four Barton Springs, Figure 10); and
- Salado Springs, Salado (Figure 11).
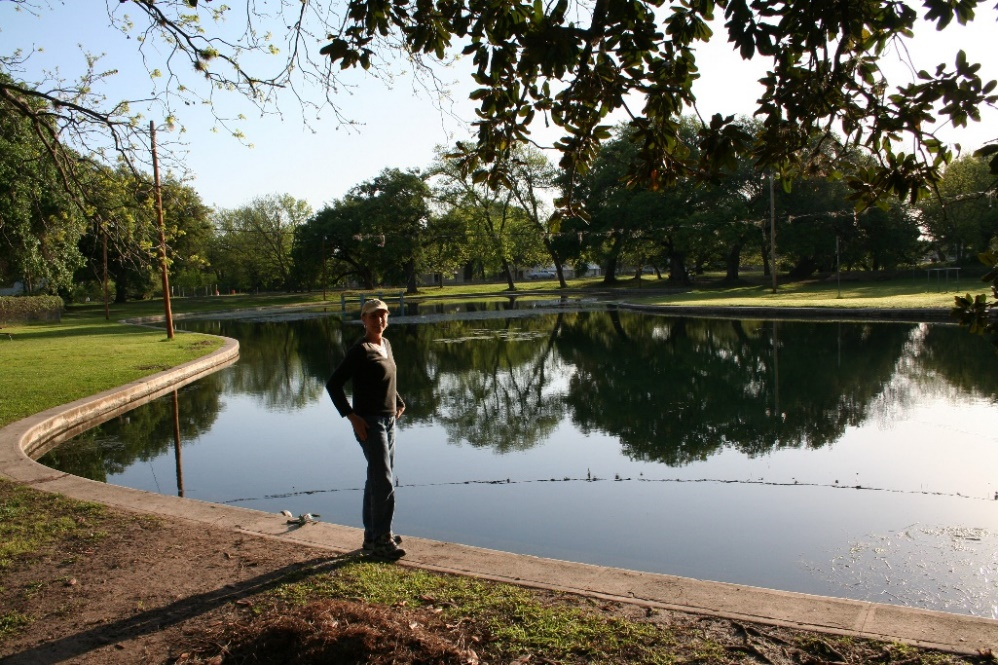
Figure 3 – Las Moras (or Fort Clark) Springs, Brackettville (photo courtesy of Geary Schindel).
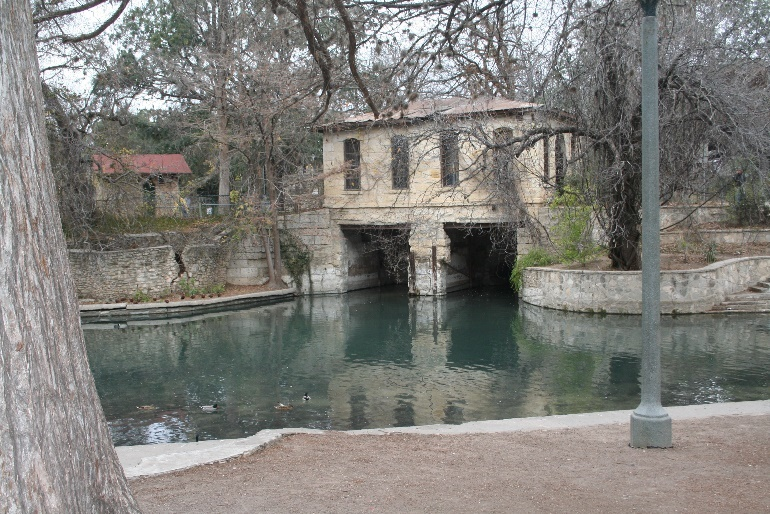
Figure 4 – San Antonio Springs at the head of the San Antonio River (photo courtesy of Geary Schindel).
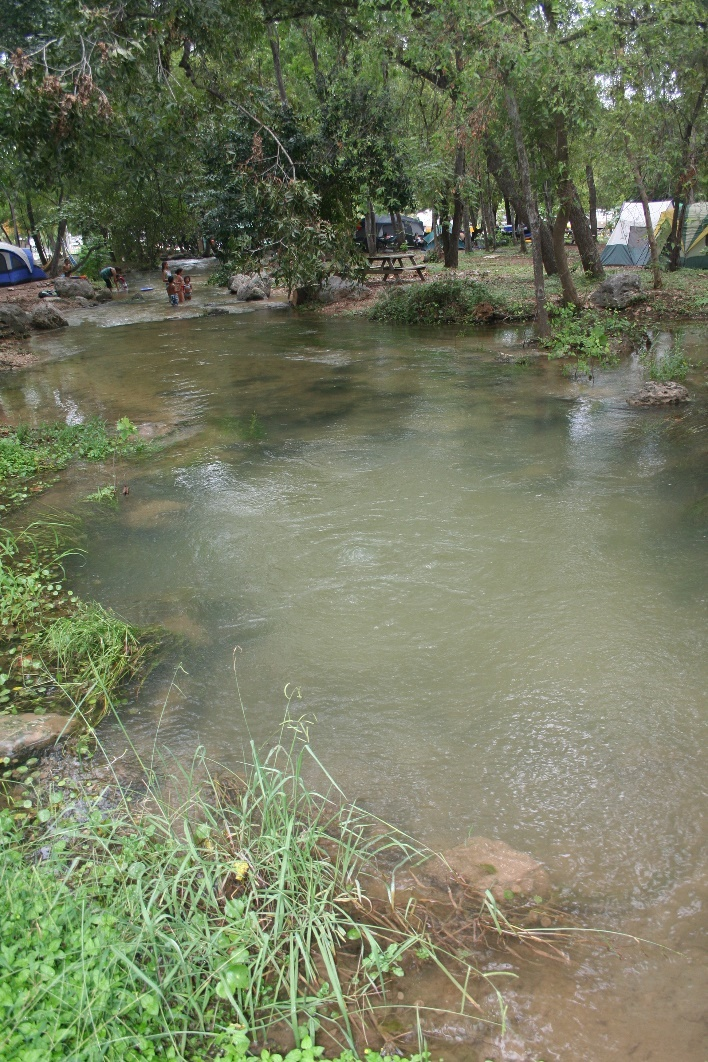
Figure 5 – Hueco Springs (photo courtesy of Geary Schindel).
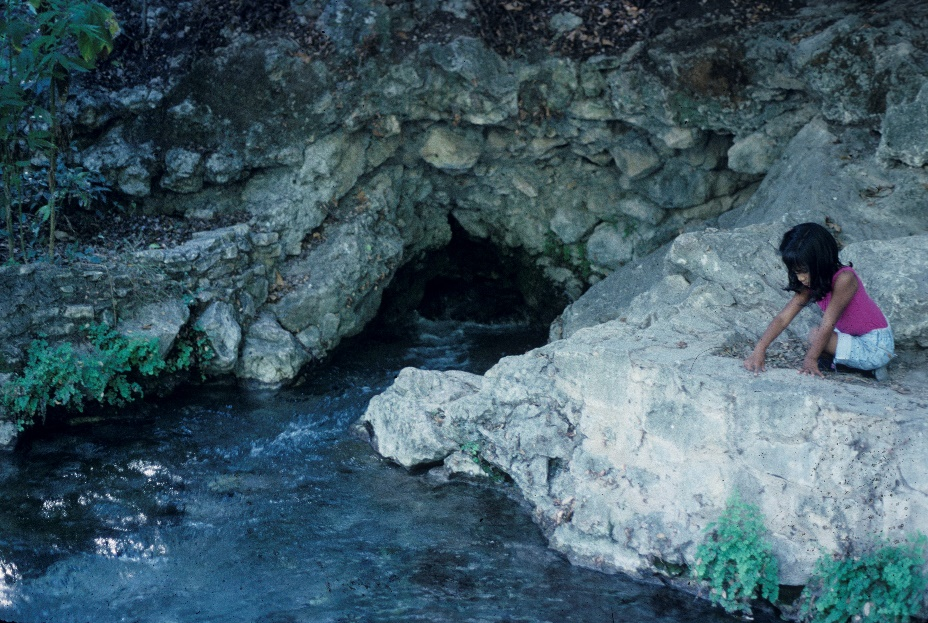
Figure 6 – Comal Spring 1, one of the Comal Springs, New Braunfels (Sharp et al., 2019a).
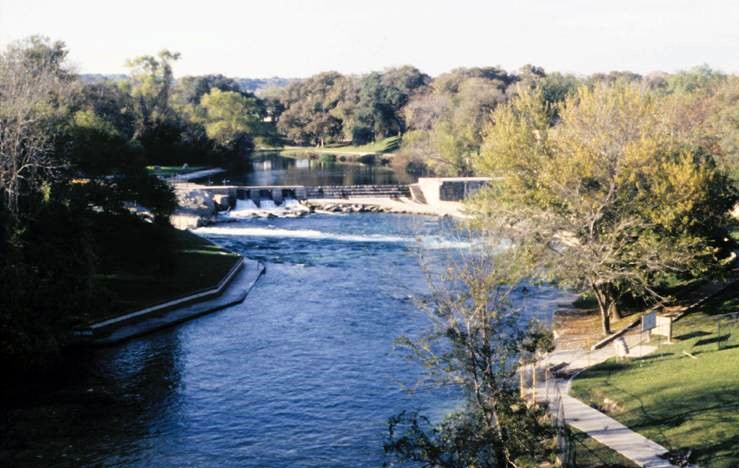
Figure 7 – The Comal River in New Braunfels carries the combined discharge of all Comal Springs. (photo by J.M. Sharp).
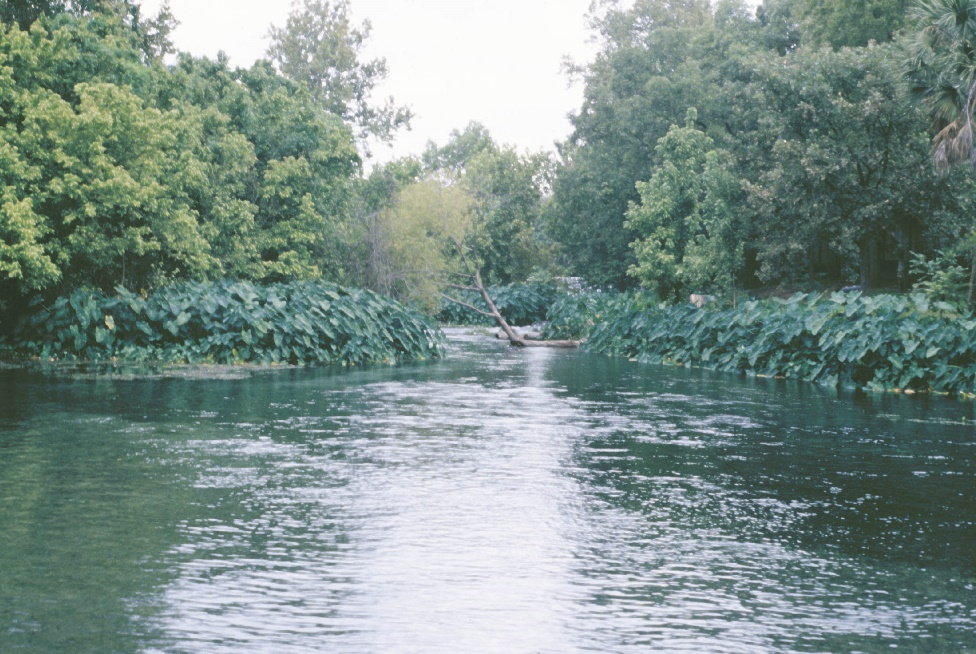
Figure 8 – San Marcos Spring discharge, San Marcos (Sharp et al., 2019a).
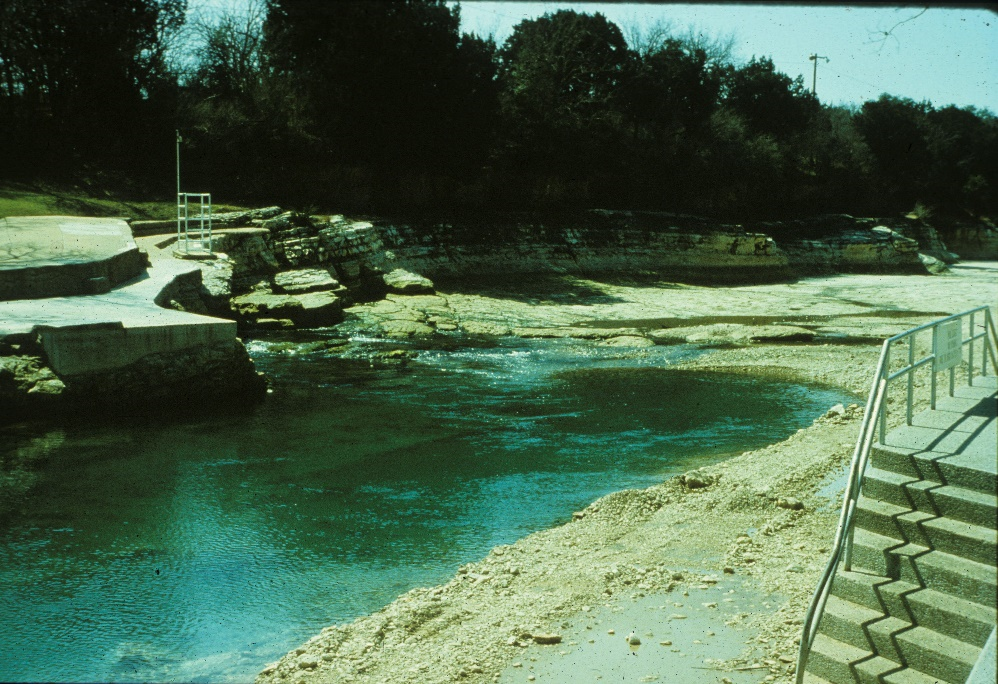
Figure 9 – Main Barton Spring (one of the four Barton Springs), Austin (photo by J.M. Sharp).
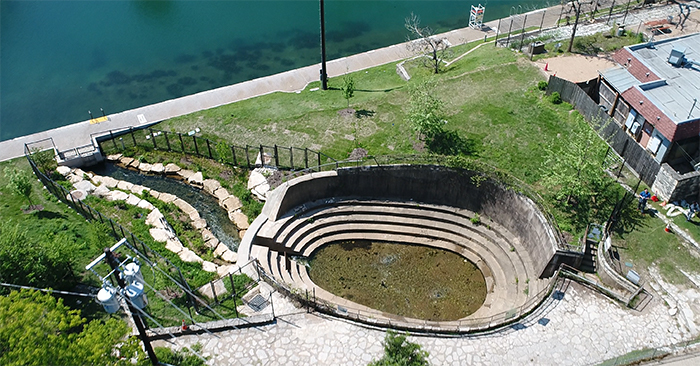
Figure 10 – Eliza Spring (one of the four Barton Springs).
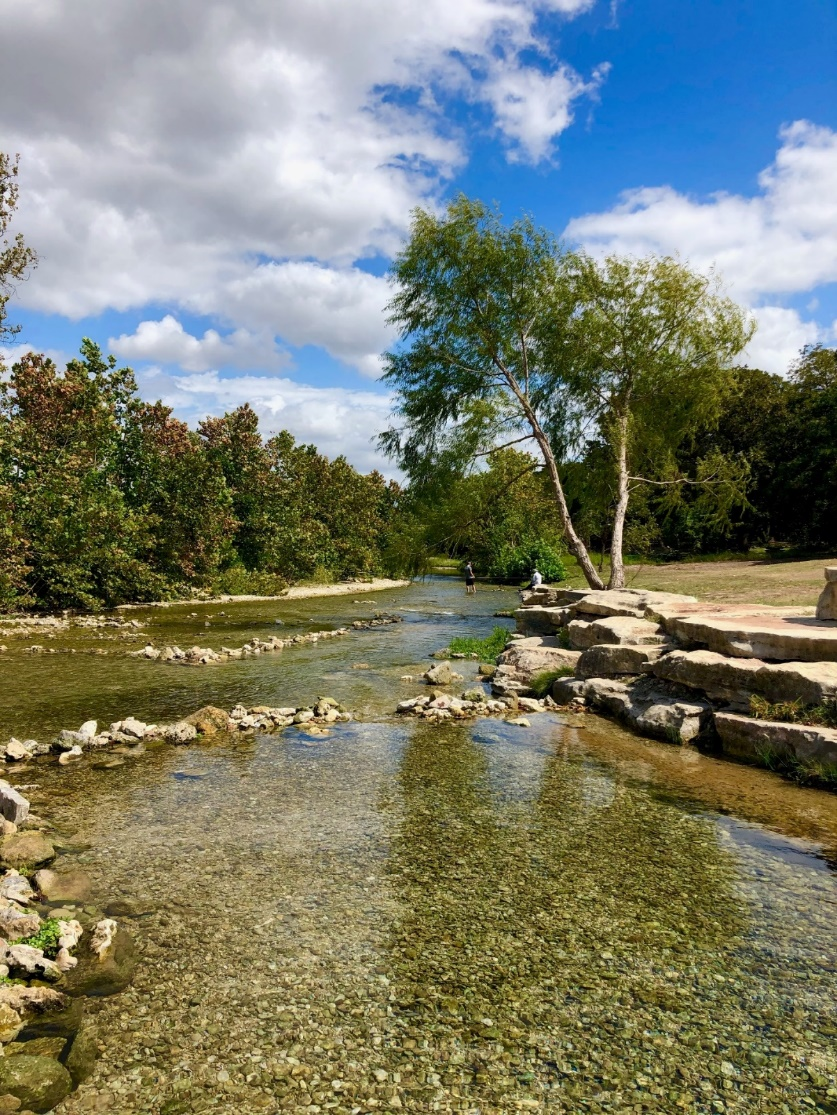
Figure 11 – Salado Springs, Salado (photo courtesy of Ashley Trappe).
In 1975, the Edwards Aquifer in the San Antonio area was the first in the USA to be designated as a sole source aquifer1 by the United States Environmental Protection Agency (EPA). The aquifer also hosts unique groundwater, cave, and spring ecosystems and is famous for the large springs that discharge from the aquifer along the Balcones Fault Zone (Figure 2 and Figure 12). The cities of Salado, Austin, San Marcos, New Braunfels, San Antonio, Uvalde, Brackettville, and Del Rio (west of the aquifer) developed along the Balcones Fault Zone near springs.
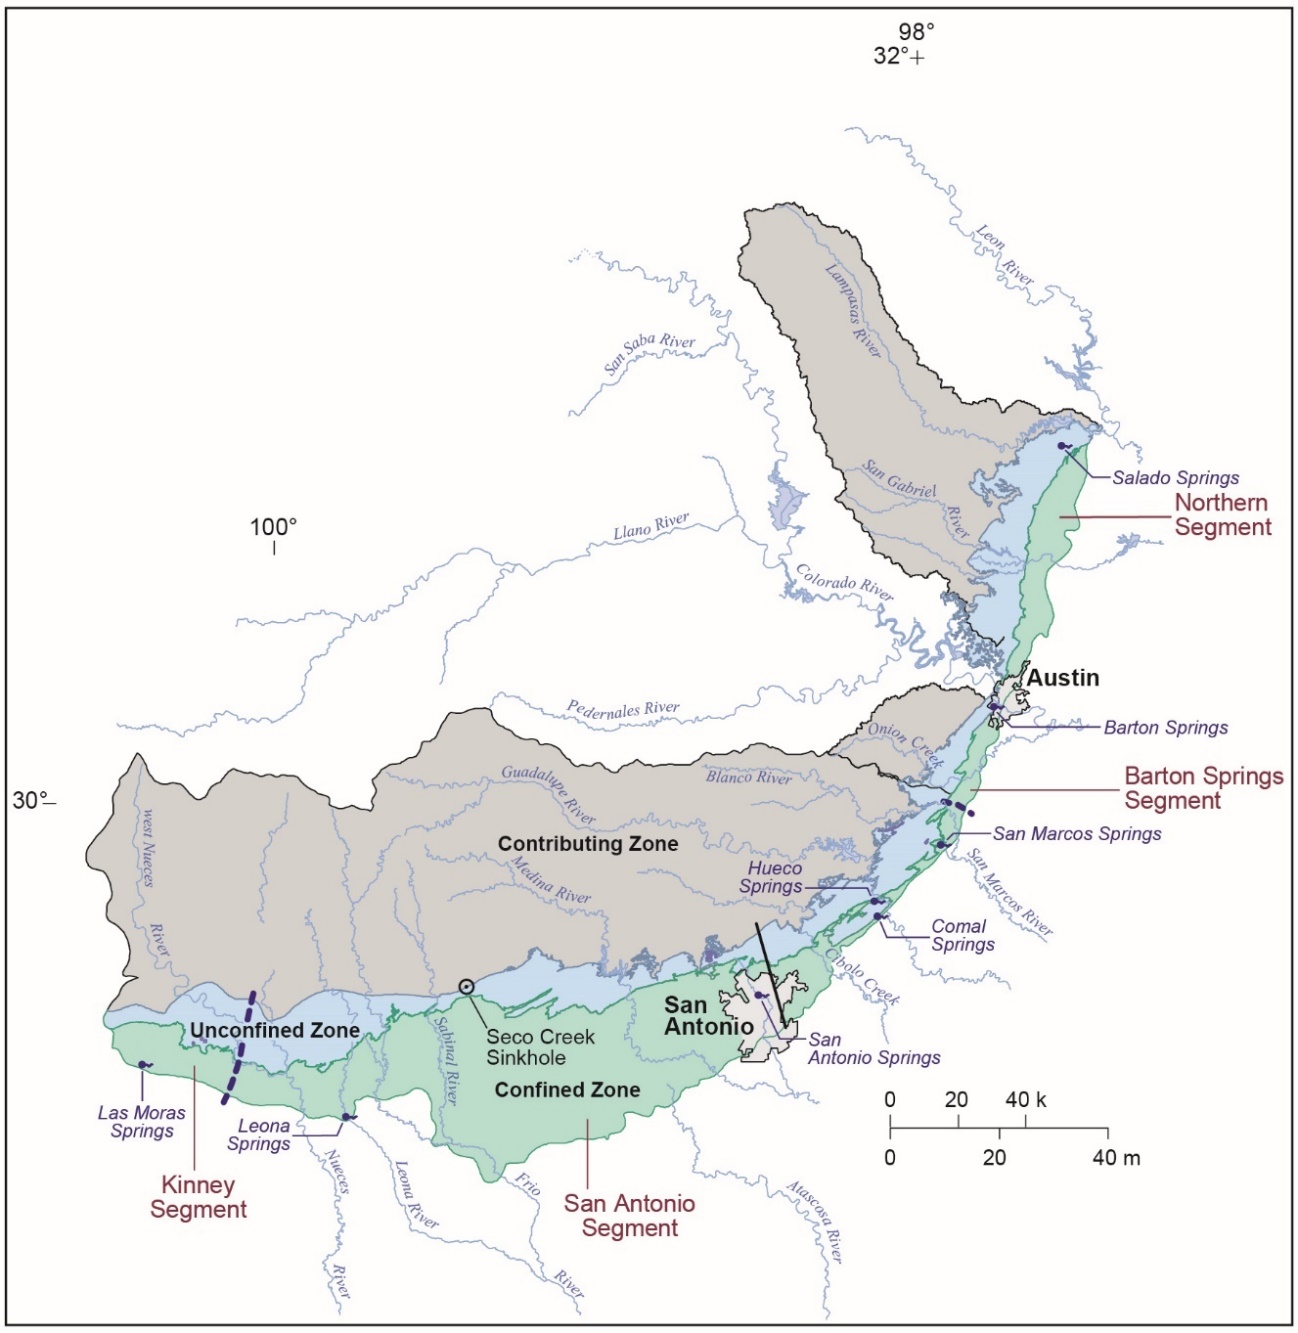
Figure 12 – Edwards Aquifer contributing zone, unconfined (i.e., recharge) zone, confined zone and major springs (modified from Mahler and Musgrove, 2019). The Seco Creek (Valdina Farms) sinkhole recharge feature and the groundwater divides bounding the San Antonio segment are also shown. The dark line through San Antonio denotes the location of a cross section discussed in Section 4.2.
In this book, we review the unique characteristics of the Edwards (Balcones Fault Zone) Aquifer, its stratigraphy and structure, flow systems, natural recharge and discharge, water chemistry, aquifer ecology and endangered species, as well as its legal and administrative systems. We also look at the challenges (including future pumping stresses, land use changes, emerging contaminants, climate change, and evolving technologies) that will affect the Edwards Aquifer. Detailed information on many of these topics is provided by Sharp and others (2019a, b). The uniqueness and importance of this aquifer to the general public, industry and the environment have been the subject of many discussions and reports (e.g., Technical Advisory Panel, 1990; Grubb, 1997; Sharp and Banner, 1997; Sharp, 2002; Hardberger, 2019). The literature is vast and the reader is encouraged to refer to the cited sources to obtain details on particular subject areas of interest.
The Edwards Aquifer has been recognized for over a century beginning with Hill (1890) and Hill and Vaughan (1898). Recently, Sharp and others (2019a) compiled a suite of summary papers, but even with a long history of research, there remain significant unknowns and uncertainties. More research is required to understand and manage the Edwards Aquifer successfully and sustainably in the face of significant challenges as Texas, and, in particular, central Texas is challenged with rapid growth and the ensuing aquifer overexploitation (Mace, 2019).
Hill and Vaughan (1898) named the Edwards Limestone Formation, which refers to the firm, white, resistant, shelly, cherty, porous limestone and dolomite above the Glen Rose Formation and below the Georgetown, Del Rio Clay, or Buda formations (Rose, 1972). The Glen Rose, Georgetown, and Buda are carbonate rocks. The Del Rio is a swelling clay shale and acts as an efficient confining unit. Hill (1890, page 17) described “The Balcones” Escarpment as being “accompanied by faulting of several hundred feet” and elaborated that “The Spanish speaking people—ever ready with an appropriate descriptive geographical name—have called this scarp west of San Antonio ‘El Balcones’.” The scarp separates the Texas Hill Country from the Gulf Coastal Plain provinces (Bureau of Economic Geology, 1996). Hill (1890, page 18), describes the most distinctive feature of the aquifer associated with the scarp as:
“… a line of springs which find their way to the surface through the fault and joints overhanging the line of disturbance. The most conspicuous of these are the springs of the Leona, the San Pedro springs at San Antonio, which are the immediate source of the San Antonio River; the springs at New Braunfels, and the spring of San Marcos. Near Austin, the Barton, Mormon, Sieders [Berry and others (2017) provide a current description], and a group of magnificent unnamed springs in the bluffs of the river, immediately west of the city, mark the line. North of the Colorado the springs of Round Rock, Georgetown, Salado, and those southwest of Dallas, mark the line. All of these are great gushing streams of water bursting suddenly from the rocks, and flowing off in large streams, discharging thousands of gallons per hour. They are natural artesian wells made by rents in the rock. It is an interesting economic fact that anywhere within a few miles of these natural wells, artificial ones can be obtained by boring, as has been done at San Antonio, Fort Worth, Austin and Waco.”
Classification of the Edwards Aquifer requires that its complexity be recognized. An aquifer is defined as a geologic formation, group of formations, or a part of a formation (i.e., a consolidated or unconsolidated geologic unit or set of connected units) that yields water of suitable quality to wells or springs in economically usable amounts (Meinzer, 1923; Sharp, 2017). A geologic formation is a body of rock strata that consists of a certain lithology or combination of lithologies (i.e., a lithologically mappable unit). It is advisable not to confuse the definition of a geologic formation and an aquifer. Aquifers are commonly defined by formation(s) rather than their hydrological connections, which can raise issues for aquifer management. Intra- and inter-aquifer connections remain fundamental research questions.
The Edwards Aquifer is an aquifer system—a set of aquifers that are variably connected. However, we refer to it here as a singular aquifer, the Edwards Aquifer (Figure 2). The major components in the Edwards Aquifer system are the Edwards (Balcones Fault Zone) Aquifer, the Washita Prairies, the Edwards-Trinity Plateau, and the Rio Grande system (Table 1). Similar aquifer units extend into Mexico. By definition, this classifies the Edwards Aquifer system as a transboundary aquifer (Sprouse, 2009; Sanchez et al., 2016, 2018; Sanchez and Rodriguez, 2021). Each component is further classified or defined based on its particular attributes.
Table 1 – The Edwards Aquifer system
| Major Component | Subclassification |
| Balcones Fault Zone system | Northern segment |
Barton Springs segment
|
|
San Antonio segment
|
|
| Kinney segment | |
| Washita Prairies | |
| Rio Grande system | Devils River catchment |
| Del Rio pool | |
| Edwards-Trinity Plateau | Edwards Plateau |
| Stockton Plateau |
The Edwards (Balcones Fault Zone) Aquifer includes three major segments—the San Antonio segment, the Barton Springs segment, and the Northern (north of the Colorado River) segment—and one minor segment, the Kinney segment. Segments are defined as subdivisions within an aquifer that are generally hydraulically independent, although hydraulic connection under certain conditions may exist (Land et al., 2011). The Kinney segment is considered minor due to its limited spatial extent when compared with the other major segments. Historically, that portion of the Edwards Aquifer in Kinney County to the east of the groundwater divide located between Mud and Pinto creeks in Kinney County was included in the Uvalde pool of the San Antonio segment (e.g., Maclay, 1995). However, recent studies (Green et al., 2006, 2019c) indicate that this portion is a separate segment that is not hydraulically connected to the remainder of the San Antonio segment. For this reason, that portion of the Edwards Aquifer in Kinney County to the east of the Mud Creek/Pinto Creek groundwater divide is now designated as the Kinney segment.
The Edwards (Balcones Fault Zone) Aquifer has been further delineated into pools, which describe semi-detached groundwater basins within a segment (Figure 2 and Figure 12). The San Antonio segment is subdivided into two pools: the larger and more significant San Antonio pool (Green et al., 2019b) and the Uvalde pool (Green et al., 2019a) located to the west (Figure 12). The Barton Springs segment contains two pools, the main pool that primarily discharges to Barton Springs, and a smaller pool that discharges to Cold Springs and directly to the Colorado River (Hauwert et al., 2004; Hunt et al., 2019). Separate pools are not yet identified in the Northern segment. The Northern segment is separated from the Barton Springs segment by the Colorado River. The greater Colorado River watershed and the river itself do not recharge the Edwards Aquifer in any meaningful way. Hence, the Colorado River watershed is not identified as a contributing zone to the Edwards Aquifer (Figure 2 and Figure 12).
The segments and aquifer boundaries are defined by:
- where the aquifer rocks have been eroded;
- where faults abut low-permeability strata (no-flow boundaries);
- groundwater divides (generally treated as no-flow boundaries);
- the Colorado River (separating the Barton Springs and Northern segments); and,
- the bad-water (or saline-water) line2 (generally treated as a no-flow boundary), which is the southern and eastern border of the aquifer where the water is not potable and where water circulation is limited. The “line” is actually a zone (Figure 13), although in some cases it is delineated by faults.
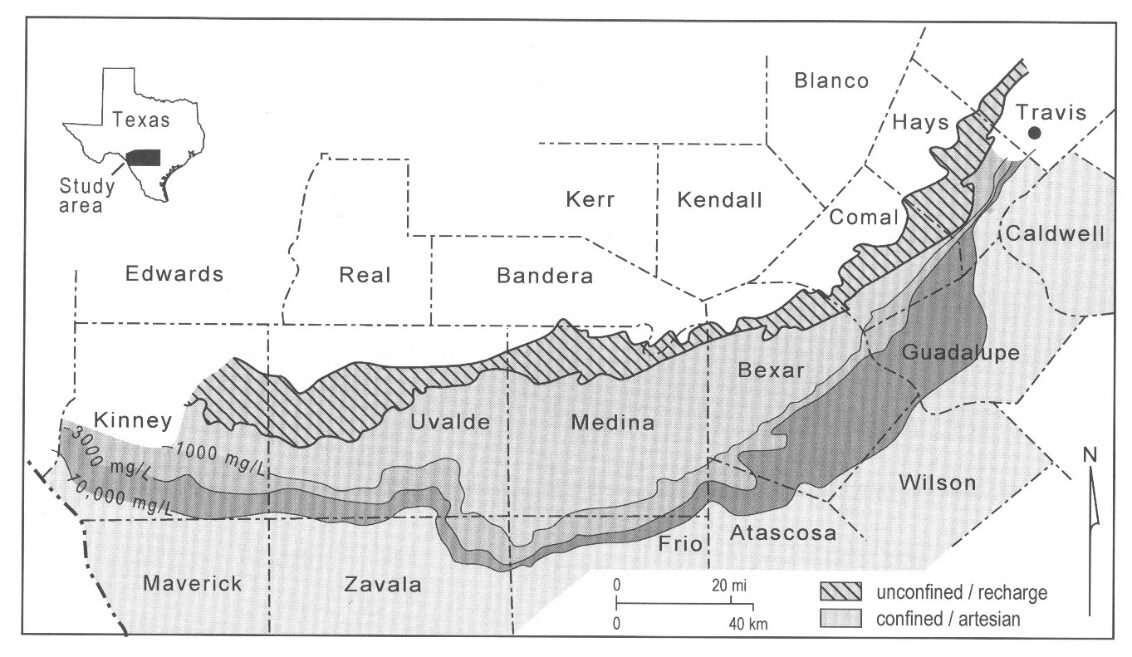
Figure 13 – Bad-water transition zone (Sharp and Smith, 2019) in the San Antonio segment. The dot in the upper right of the figure marks the location of a multiport well (Smith and Hunt, 2019). The transition zone is divided into slightly brackish (dark gray area between the 1,000 and 3,000 milligrams per liter [mg/L] isocons) and brackish (darker gray areas between the 3,000 and 10,000 mg/L isocons).
Fault barriers may create abrupt changes in aquifer properties (Smith et al., 2017). In addition, although isocons (lines or surfaces of equal salinity) are shown as a single line on most maps, the salinity can vary vertically between aquifer units. Water salinity transitions from fresh to brackish (> 103 mg/L) or saline (> 104 mg/L) across this zone (Sharp and Smith, 2019, Figure 2 therein). Waters are also reducing in the bad-water zone. Bennett and Sayre (1962) were able to map the bad-water line by the absence of hydrogen sulfide (H2S) up dip of the line, which is also described in Bertetti and Adkins (2020). Although this last boundary is defined by water chemistry, it is also a physical boundary. The aquifer strata downdip have not been subjected to intense post-Miocene karstification. Consequently, there is a major decrease in permeability such that, in numerical models of groundwater flow, the bad-water line is commonly modeled as a no-flow boundary.
The reasons for the increase in salinity are threefold: upwelling fluids from deeper coastward units with saline fluids, dissolution of evaporitic minerals along flow paths, and upward cross-formational flow from the underlying Trinity aquifers. Hoff and Dutton (2017) mapped equivalent freshwater heads in the confined zone and units down dip of the San Antonio segment (Sharp and Smith, 2019, Figure 4 therein) showing the flow of more saline fluids towards the aquifer that has also been inferred from geochemical analyses (e.g., Land and Prezbindowski, 1981; Sharp and Clement, 1988; Abongwa and Den, 2021). In addition, Smith and others (2017) showed that the potential groundwater flow directions for equivalent freshwater heads vary from out of or into the freshwater aquifer depending on wet versus drought conditions, respectively. Figure 14 shows the hydrochemical facies of the bad-water zone. In the northern part of the San Antonio segment and in the Barton Springs segment, the waters are a Na-Cl hydrochemical facies. In the western portion of this segment, waters are a Ca-SO4 facies indicating the dissolution of gypsum and anhydrite as the major factor. In the Northern segment, upward cross-formational flow becomes increasingly important. Sharp and Clement (1988) and Oetting and others (1996) provide the chemical and isotopic differentiation of the hydrochemical facies of the bad-water zone (Sharp and Smith, 2019, Figure 1 therein). The location of the bad-water line has remained relatively constant despite droughts, high recharge events, and pumping stresses (Sharp and Smith, 2019).
Figure 14 – Bad-water zone facies (modified from Sharp and Smith, 2019). Schoeller diagrams are in milliequivalents per liter (meq/L). Bad-water line (1,000 mg/L) is generalized.
Aquifer boundary definitions are complicated for two reasons.
- Groundwater divides can shift with variations in recharge and, in some cases, may disappear in droughts (Smith et al., 2012).
- Tracing studies (Johnson et al., 2019) and multiport well tests (Smith and Hunt, 2019) have shown that other formations are effectively part of the aquifer, particularly the underlying Upper Glen Rose Formation. In some locales, the Upper Glen Rose Formation (Upper Trinity Aquifer) is faulted against Edwards Aquifer strata in the recharge zone and is hydraulically part of the Edwards Aquifer (Johnson et al., 2010). Near Barton Springs, multiport well tests show the upper strata of the Glen Rose Formation are (vertically) hydraulically connected to the Edwards Aquifer in the confined zone (Smith and Hunt, 2019). Another example is a portion of the Cibolo Creek watershed (north of San Antonio, Figure 12), comprised of the Lower Glen Rose (Trinity Aquifer), which is mapped as part of the Edwards Aquifer Recharge Zone due to its highly karstic nature and hydrologic connection to the adjacent and down-gradient Edwards Aquifer.
The Edwards Aquifer includes three major hydrologic zones or domains (Figure 12 and Figure 15) that are continually being refined with new data, especially geologic mapping and tracer tests (e.g., Johnson et al., 2010; Hunt et al., 2017; Hackett, 2019; Smith et al., 2020). The zones are important for understanding the hydrogeologic function of the aquifer system and have regulatory (land use) implications. The zones are shown in Figure 15 and are described here.
- The catchment or contributing zone, which provides allogenic recharge (surface water from higher elevations areas that do not overlie the karst, that seeps into dolines or fractures overlying the karst aquifer) to the Edwards Aquifer and includes outcrops of the Trinity Aquifer. This zone is not part of the aquifer as defined by its boundaries, but the streams flowing out of it are the major source of aquifer recharge (Maclay, 1995; Passarello et al., 2012; Hauwert and Sharp, 2014; Mahler and Musgrove, 2019). This area is underlain largely by Trinity geologic units and provides recharge to the Trinity aquifers.
- The recharge (outcrop) zone where aquifer rocks are exposed at the surface and receive autogenic recharge (recharge that is derived from within the carbonate catchment) including both diffuse (from precipitation) and discrete (from losing steams) processes.
- The confined (artesian) zone, which is generally overlain by the low-permeability Del Rio Clay as well as other low-permeability formations.

Figure 15 – A generic cross section through the Edwards Aquifers. Major springs discharge in the towns of Uvalde, San Antonio, New Braunfels, San Marcos, Austin, Georgetown, and Salado. Most of the recharge occurs along losing streams in the recharge zone. More detailed, site-specific cross sections can be found in Hunt and others (2019), Johnson and others (2010), Jones (2019), Lindgren and others (2004), Scanlonand others(2001), and Tolland others (2019).
1A sole source aquifer as defined by the United States Environmental Protection Agency, EPA (2020), is: 1) one that supplies at least 50 percent of the drinking water for its service area, and 2) where there are no reasonably available alternative drinking water resources should the aquifer become contaminated.
2The bad-water line is also referred to as the saline water line. Here we retain the term “bad-water” because of its historical use (water beyond this line was not considered potable) and because these waters range from brackish to saline. Some of the brackish waters are suitable for irrigation and livestock. Furthermore, waters in the bad-water zone are being considered for desalination.