5.6 Mini-Piezometers
Mini-piezometers (or piezometers) are commonly open at the end or include a perforated interval a few centimeters long with a series of cut slots or drilled holes near the bottom end of a metal or PVC pipe (Woessner, 2017). In areas with fine sediments steel wool is sometimes installed inside the end of the pipe or a sleeve of nylon mesh wrapped around the perforated interval to prevent plugging (Lee and Cherry, 1978; Simonds and Sinclair, 2002). Mini-piezometers can be driven and pounded into floodplain sediments with shallow water tables (e.g., Rivett et al., 2008; Brodie et al., 2007) and, less commonly, installed in drilled holes in bedrock stream bottoms (Kennedy, 2017).
The mini-piezometer is typically hand driven into the bed to a specified depth (e.g., 10 to 100+ cm) (Figure 61). In some cases, a conductor metal casing with an expendable bottom plug or center rod is driven to depth and then a slightly smaller diameter piezometer is inserted, and the conductor casing removed. The unconsolidated sediment is assumed/encouraged to settle around the piezometer, sealing it into the sediments (preventing short circuiting of surface water). In some cases, a flexible clear tube long enough to extend above the surface of the surface-water feature can be inserted in the conductor casing and used as the mini piezometer (Lee and Cherry, 1978). Installation of mini-piezometers in consolidated sediments (bedrock) requires mechanical drilling of boreholes and piezometer installation that seals the perforated interval from the surface-water body (Figure 62).

Kennedy (2017) used small coring tools to install mini-piezometers and seepage meters in a dolostone stream bottom. A Shaw Backpack Drill (Shaw Tool Ltd., Yamhill, OR, USA) was used to install riverbed piezometers (Figure 62a). Lucius (2016) also described mini-piezometer bedrock installation methods to measure heads and nitrogen rich groundwater discharge to a lake (Figure 62b).

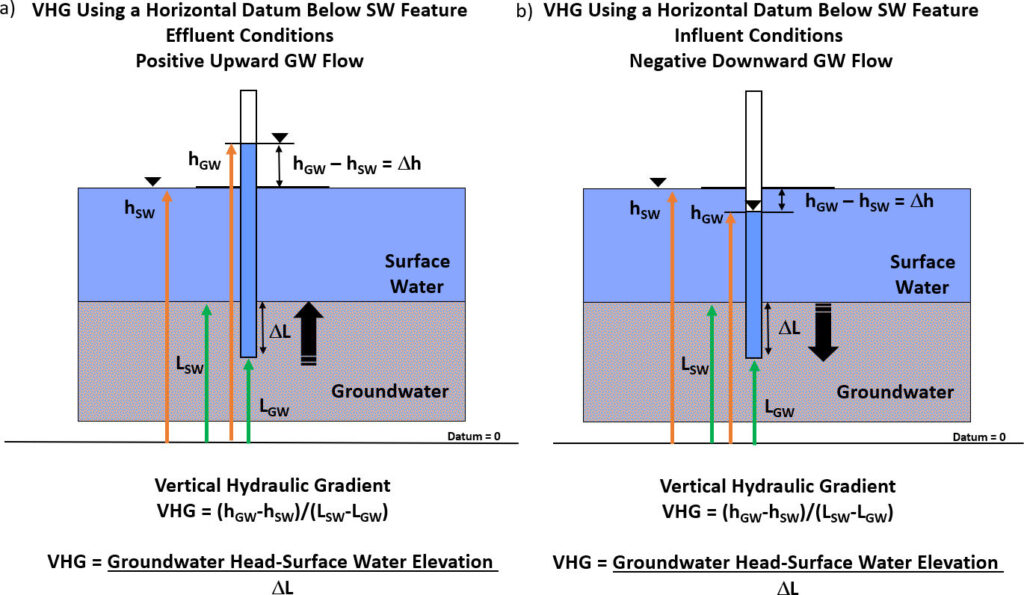
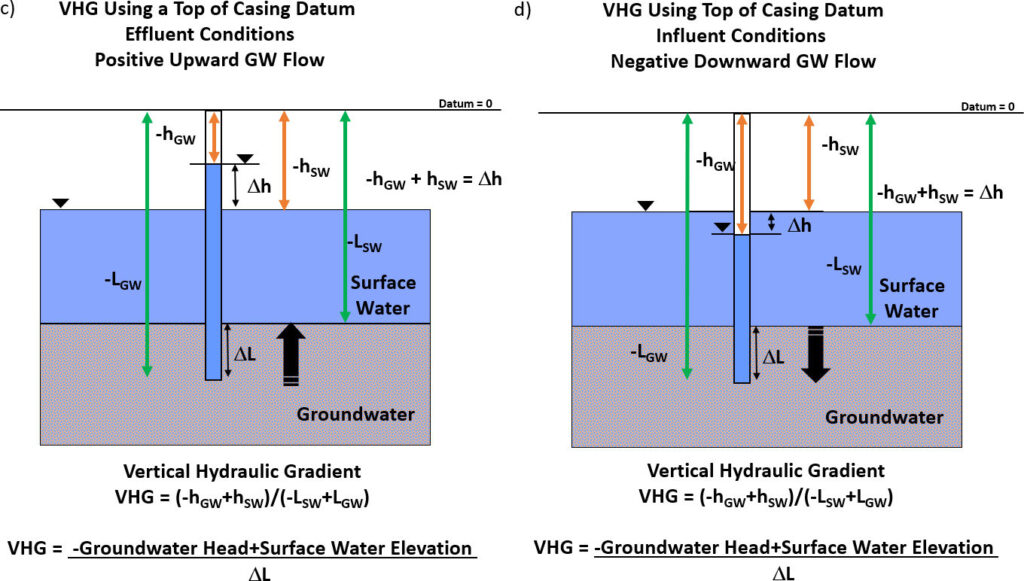
To determine the magnitude of the vertical groundwater gradient at the mini-piezometer location, the difference between the groundwater elevation (head) as measured in the mini-piezometer and surface-water stage (Dh) is divided by the depth to which the instrument penetrates the sediment (L) (Figure 63a and b). When a slotted or perforated interval is used, the midpoint of the perforations is used as the penetration depth. The convention used in the exchange literature is that gradients referred to as vertical hydraulic gradients, VHGs, are computed relative to the groundwater level in the mini-piezometer. A positive gradient (groundwater level is higher than the surface-water stage) indicates effluent conditions, the upward movement of groundwater, thus groundwater discharges to the surface-water body (e.g., Simonds and Sinclair, 2002; Woessner, 2017). A negative gradient indicates surface water is recharging the underlying groundwater, downward movement of groundwater (influent conditions) as shown in Figure 63b. The VHG may also be computed from measuring heads from the top of the mini-piezometer casing using the casing as the local datum (Figure 63c and d). VHGs are commonly cited in groundwater-surface water exchange literature and mapped spatially and temporally to indicate where groundwater is entering and leaving a surface water body bed. The concept of upward flow of groundwater as a positive gradient is a convention of the groundwater exchange literature. However, exchange directions and the VHG should be clearly defined when reporting values. It should be noted that in some works, only the vertical difference between the groundwater head and surface-water elevation is reported and used to infer the direction of water movement. This information is qualitative, though useful. However, it is important to note that this difference is not the VHG as the water level difference is not divided by the depth of mini-piezometer penetration (L) into the bed. Gradients are needed to compute groundwater discharge, flux and velocities.
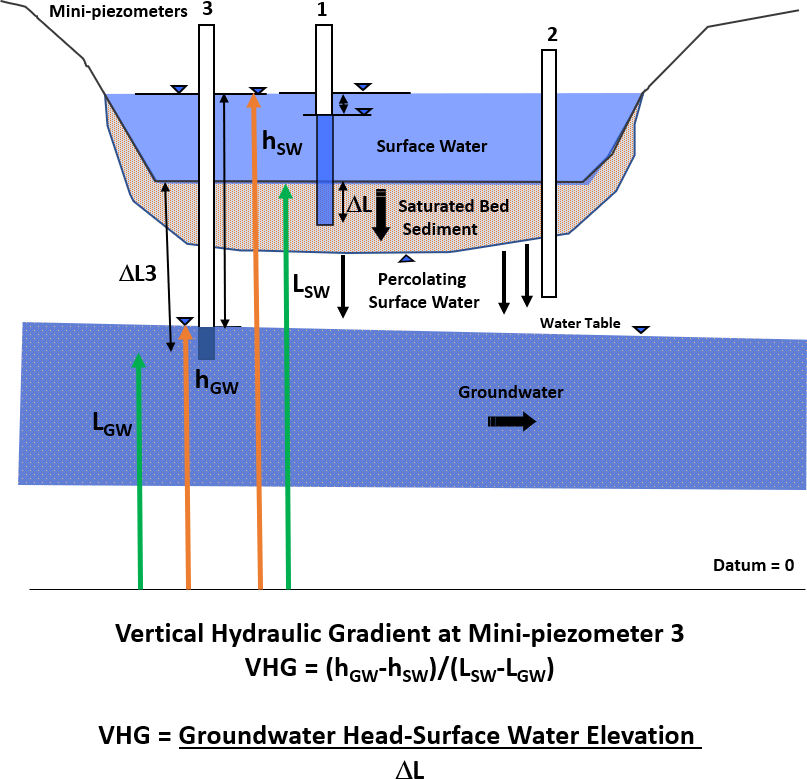
When mini-piezometers are driven into the bed of an influent feature and the water table is connected to the surface-water feature, VHG represents saturated flow conditions (Figure 63b and d). However, if the surface-water feature is disconnected from the water table (water table is below the bottom of the saturated sediments, e.g., losing river, lake or wetland, or disconnected wetland) then mini-piezometer data will reflect vertical hydraulic gradients that do not represent saturated flow conditions (Figure 64 mini-piezometer 3). If such conditions are present, theoretically, a piezometer could be installed in the percolation zone (vadose zone) and no groundwater level would be present (mini-piezometer 2 in Figure 64). VHG values computed for conditions shown in mini-piezometer 3 may yield large negative gradients, in some cases values larger than -1, when head change and penetration ratios are large. In general, when a large negative VHG is computed, data should be reviewed to determine if the influent feature is disconnected from the water table.
Water levels used to compute VHGs can be measured using several tools. Most often, the top of the mini-piezometer is used as a local reference as shown in Figure 63c and d. Measurements recorded are the depth to water inside the mini-piezometer, the distance from the top of the mini-piezometer to the surface of the surface-water feature and the depth of penetration into the bed (Figure 65). The type of tool used to measure the water level is a function of the inside diameter of the mini-piezometer. Thus, when designing piezometers, the measurement tool should be considered. Tools include a small diameter electric tape, steel tape, and/or chalked rod and measuring tape (Figure 65) (Woessner, 2017; Baxter et al., 2003). Transducers installed both in the mini-piezometer and surface-water body can be used to record head difference over time (e.g., Freeman et al., 2004). In some cases, where head differences are small or difficult to measure, separate clear flexible tubing can be inserted in the water body and attached to the mini-piezometer, linked, and a vacuum applied to this loop. This manometer board setup draws water levels above the surface and to a board with a vertical scale. Water levels are compared, and the differences noted (Figure 65) (e.g., Lee and Cherry, 1978; Simonds and Sinclair, 2002; Cox et al., 2005).

Mini-piezometer gradient data can be used with measurements of sediment and bedrock hydraulic properties to compute local flux rates from Darcy’s law, and with seepage meter data to compute local bed-sediment hydraulic conductivities. When mini-piezometers are designed with a perforated interval that allows water to freely enter and leave the piezometer, falling head or constant head slug tests can be conducted to estimate the horizontal hydraulic conductivity of the sediments penetrated by the perforated interval (e.g., Hvorslev, 1951; Bouwer and Rice, 1976, 1989; Van der Kamp, 1976; Butler, 1997; Butler et al., 2003; Butler and Healey, 1998). Sampling of bed and floodplain sediments and coring of bedrock can be used to estimate and measure hydraulic conductivities using lab and field methods (e.g., Freeze and Cherry, 1979; Fetter, 2001; Cedergren, 1997; Woessner and Poeter, 2020). As the exchange of water at the bed is assumed to be vertical, vertical hydraulic conductivity values are needed. Often vertical hydraulic conductivity is estimated from horizontal hydraulic conductivity by assuming an anisotropy ratio, that is a ratio of horizontal hydraulic conductivity (Kh) and vertical hydraulic conductivity (Kv) (e.g., Fetter, 2001; Anderson et al., 2015). The challenge with this approach is selecting an appropriate ratio; the range is typically between 1 and 1000. Ideally, independent methods to measure or estimate the vertical hydraulic conductivity directly in some of the locations where horizontal values are estimated is recommended. This can be accomplished in some settings by using lab permeameter measurements on undisturbed vertical cores of the site sediments and bedrock. If conditions permit, pushing or pounding of an open-ended pipe into the bottom sediments (e.g., on the order of 20 to 50 cm) can be used to conduct an in situ falling head permeameter test (e.g., Kennedy et al., 2010). Pairing mini-piezometer measurements with seepage meter flux values is a common method used to compute vertical hydraulic conductivities when both instruments are installed at a single site.
When both mini-piezometer VHG data and estimates of vertical hydraulic conductivities are obtained at a site, flux rates can be computed using Darcy’s law (assuming vertical flow and steady state conditions) as shown in Equation 3. When gradients derived from VHG determinations are used in Darcy’s Law related equations the convention that groundwater flow is always from high to low heads applies and the value of the measured gradient at a site is always entered as a negative value so that the computed term is positive. The sign of the VHG can then be used to describe if the discharge, flux or velocity is related to upward or downward movement of site groundwater. For example, field gradient data from measurements of groundwater levels in mini-piezometers and surface-water stages can be used to calculate the quantity of groundwater flux through the bed as shown in Equation 3.
 |
(3) |
where:
| Q | = | discharge (L3/T) |
| A | = | cross-sectional area (L2) |
| Q/A | = | flux (L3/(L2T)) |
| Kv | = | vertical hydraulic conductivity of the sediments (L/T) |
| i | = | gradient always entered as a negative value of the measured VHG(L/L) |