Box 6 Application of Mini-Piezometers, Seepage Meters, and Temperature Contrasts
The United States Geological Survey assessed the exchange in a 3-mi (4.8 km) section of Chapman Creek that passes by a landfill near Tremount City, Clark County, west-central Ohio, USA (Dumouchelle, 2001) as shown in Figure Box 6-1. The study’s purpose was to assess how the stream water and groundwater interacted in the vicinity of the landfill site. The stream reach was instrumented with four piezometers, two seepage meters, five stream/streambed temperature monitors, and a seepage run was conducted by measuring the stream and tributary flows during a period of low flow.

The 2-foot (0.6 m) deep creek flows through glaciated terrain and the stream bed is composed of fine sand to large cobbles and boulders. The four piezometers were constructed of 1.25-inch (3 cm) diameter pipe with 12 to 18 inches (30 to 46 cm) of wire-wrapped screen, tipped with a drive point (sandpoint). The piezometers were driven into the stream bed so that the top of the screened interval was 2.5 to 3 feet (0.8-0.9 m) below the stream bottom. Water levels were measured (+/- 0.02 feet (0.6 cm)) with an electric tape or chalked steel tape. Seepage meters were constructed as described by Lee (1977) using a 55-galllon/208-liter drum top and a partially pre-filled plastic collection bag. Temporary piezometers were installed adjacent to the seepage meters. Sites with soft clay and little or no gravel were selected for installation. Hourly temperature monitoring of the stream and streambed water was conducted (as discussed in Section 5.8 of this book). Waterproof-cased sensors (+/- 0.7°C) were installed at sand/cobble sites where a steel fence post was driven into the stream bottom. One sensor was attached to the post just above the stream bottom and the second was buried in the stream bottom sediment about 6 to 8 inches (18-20 cm). A seepage run was conducted in October 2000 at low flow (seepage runs are discussed in Section 5.4 of this book). Discharge measurements were conducted on Chapman Creek and six tributaries using standard methods.
Shallow piezometer installation data (eight measurements) showed heads in piezometers were lower than the stream stage at P1, P2 and P3. The P4 data suggest bed water was moving upward and into the stream for three of the four measurements (Table Box 6-1). Seepage results (two measurements) for the seepage meter located near P2 showed a loss of water from prefilled bags supporting the interpretation of a losing stream section (head difference data from P2). However, seepage meter results near P3 suggested water was flowing into the meter, a contradiction to the head difference data observed at P3 (loss) (Table Box 6-2). Later analysis suggests the meter was located in coarse sediments and may not have been fully seated in the bed. Possibly, surface water flowed under the meter sides and into the seepage meter. Temperature contrast data sets indicated stream bed temperatures were similar to stream water temperatures, and daily highs and lows of stream water were slightly lagged compared to stream bed temperature (Table Box 6-3). These data are characteristic of locations where surface water is infiltrating into the stream bed (losing stream). These data are also generally supported by the piezometer data and seepage meter results at P2. The seepage run study showed that the stream was gaining between the upstream and downstream gauging locations (~3 mi, 4.8 km) as shown in Table Box 6-4.
Table Box 6-1 – Results of piezometer and stream stage head measurements at four piezometer locations shown in Figure Box 6-1. [Piezo, piezometer; P#, piezometer number; ft, feet; bmp, below measuring point; —, no data; negative differences in water levels indicates flow into the aquifer, positive differences indicated flow into the stream] (Dumouchelle, 2001).
| P1 | P2 | P3 | P4 | |||||||||
| Date 2000 | Piezo water level (ft, bmp) | Stream level (ft, bmp) | Water level difference | Piezo water level (ft, bmp) | Stream level ft, bmp) | Water level difference | Piezo water level (ft, bmp) | Stream level (ft, bmp) | Water level difference | Piezo water level (ft, bmp) | Stream level (ft, bmp) | Water level difference |
| 9-08 | 2.32 | 2.24 | -0.08 | — | — | — | 2.35 | 2.27 | -0.08 | — | — | — |
| 9-13 | — | — | — | 3.13 | 3.11 | -0.02 | 2.33 | 2.23 | -0.10 | — | — | — |
| 9-27 | 2.27 | 2.20 | -0.07 | 3.14 | 3.09 | -0.05 | 2.32 | 2.24 | -0.08 | — | — | — |
| 10-4 | 2.28 | 2.23 | -0.05 | 3.15 | 3.11 | -0.04 | 2.34 | 2.24 | -0.10 | — | — | — |
| 10-12 | 2.31 | 2.28 | -0.03 | 3.10 | 3.03 | -0.07 | 2.27 | 2.19 | -0.08 | 1.93 | 2.05 | 0.12 |
| 10-20 | 2.30 | 2.27 | -0.03 | 3.08 | 3.02 | -0.06 | 2.27 | 2.17 | -0.10 | 1.96 | 2.08 | 0.12 |
| 10-25 | 2.31 | 2.28 | -0.03 | 3.08 | 3.00 | -0.08 | 2.29 | 2.22 | -0.07 | 1.96 | 1.90 | -0.06 |
| 11-2 | 2.31 | 2.26 | -0.05 | 3.05 | 3.02 | -0.03 | 2.31 | 2.22 | -0.09 | 1.92 | 2.08 | 0.16 |
Table Box 6-2 – Results of seepage at seepage meter sites near P2 and P3 as shown in Figure Box 6-1. P2, piezometer; mL, milliliters; min, minutes (Dumouchelle, 2001).
| Test location | Initial volume (mL) | Ending volume (mL) | Change in volume (mL) | Time (min) | Difference in temporary piezometer-stream levels (feet) |
| Near P2 | 200 | 121 | -79 | 98 | -0.04 |
| Near P2 | 200 | 124 | -76 | 102 | -0.04 |
| Near P3 | 200 | 334 | 134 | 110 | -0.11 |
| Near P3 | 200 | 406 | 206 | 90 | -0.02 |
Table Box 6-3 – Results of paired temperature monitors as located in Figure Box 6-1 (Dumouchelle, 2002).
| Station | Dates of collection (2000) | Tree cover | Streambed composition | Stream depth1 (in.) | Average temperature2 (°C) | |
| Streambed | Stream water | |||||
| 1 | Oct 20-Dec 5 | Mostly shaded | Sand | 6 | 8 | 7.9 |
| 2 | Oct 20-Nov 2 | Unshaded | Fine sand, cobbles | 24 | 12.9 | 12.5 |
| 3 | Oct 20-Nov 3 | Unshaded | Cobbles, some gravel | 6 | 13.2 | 13.1 |
| 4 | Oct 20-Nov 4 | Partially Shaded | Cobbles, gravel | 9 | 12.9 | 12.8 |
| 5 | Oct 20-Nov 5 | Shaded | Sand | 9 | 13.1 | 12.9 |
| 1Depth is approximate, based on conditions of October 20, 2000. 2Average temperature listed is the average of the entire period of record. |
||||||
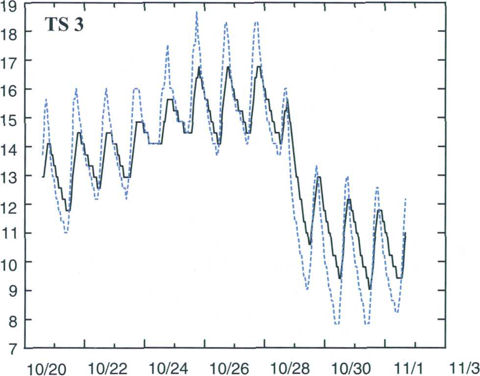
Table Box 6-4 – Results of the seepage run. Locations of steam measuring points are shown on Figure Box 6-1. [trib., tributary; W, wading (current meter) streamflow measurement; V, volumetric streamflow measurement; F, fair (+/-8 percent); G, good (+/-5 percent); E, excellent, (+/-2 percent); ft3/s, cubic feet per second; —, not applicable] (Dumouchelle, 2001).
| Site Name | Method | Quality rating | Streamflow (ft3/s) | Change in main-stem flow (ft3/s) |
| Chapman Creek at Coffin Station Road | W | F | 0.89 | — |
| Unnamed trib., At northwest intersection of Terre Haute, Thackery, and Snyder-Domer Roads | V | G | 0.008 | — |
| Unnamed trib., right bank, between Coffin Station and Terre Haute Roads | V | F | 0.007 | — |
| Chapman Creek at Snyder-Domer Road | W | F | 1.55 | 0.65 |
| Unnamed trib., left bank, upstream from Knollwood Road | V | G | 0.012 | — |
| Unnamed trib., right bank, downstream from Knollwood Road | V | E | 0.004 | — |
| Unnamed trib., left bank, upstream from Willow Dale Road | V | E | 0.005 | — |
| Chapman Creek at Willow Dale Road | W | F | 2.05 | 0.48 |
| Unnamed trib., left bank, upstream from Hominy Ridge Road | V | F | 0.007 | — |
| Chapman Creek at Hominy Ridge Road | W | G-F | 2.46 | 0.40 |
The author noted that the shallow installations of the instream instruments most likely reflected the circulation of stream water into the bed sediments (hyporheic exchange), conditions at this study site that created mostly losing conditions (Figure Box 6-3). However, the seepage run data support an interpretation that the reach is an overall gaining stream.
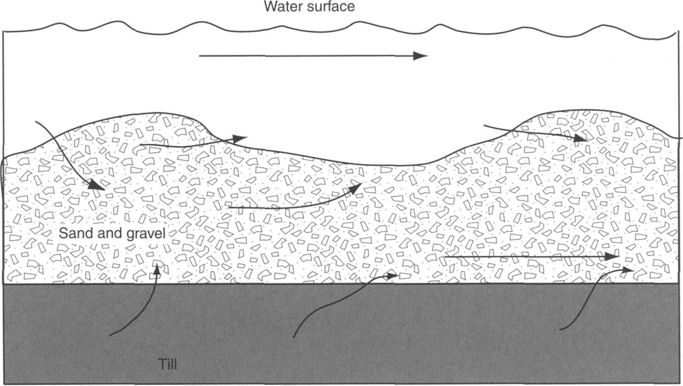
The author’s conceptual model of the groundwater exchange did not account for the different roles the coarse-grained layer and finer-grained layer played in the exchange process. Mini-piezometers nested in both the sand and gravel hyporheic system and the deeper till were needed to better define exchanges at local and in larger areas. The use of multiple methods to examine the exchange process is recommended.