2.7 Exchange at the Valley Segment/River Corridor Scale
The valley-segment scale includes exchange within the entire valley corridor over a few to 10’s of kilometers of stream channels and associated riparian zones, active and inactive floodplains, and older river terraces. Woessner (2000) described this multiple featured area as the fluvial plain (Figure 24). Except for bedrock lined channel settings, generally, the fluvial-plain sediments include deposits of anisotropic and heterogeneous materials.

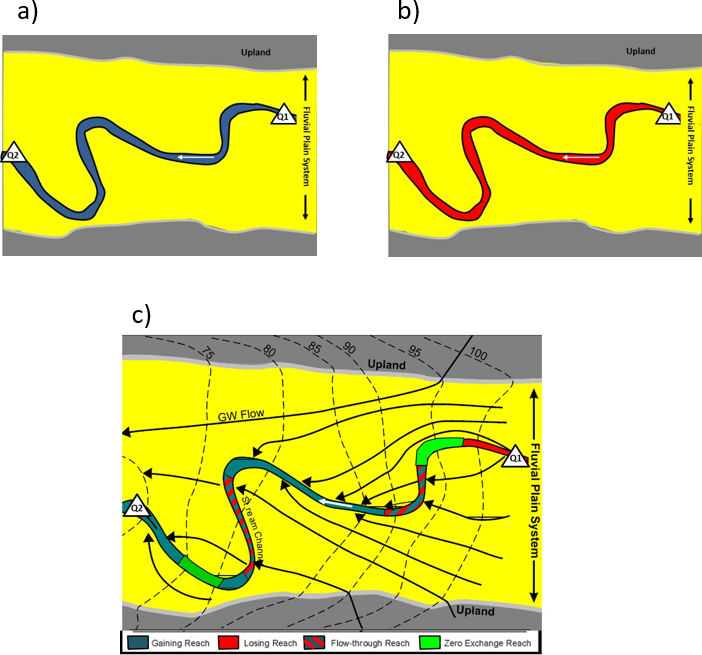
Exchange at this scale is most commonly quantified as water-balance-computed changes in streamflow between two stream gauging stations or sites. In the simplest form, an upgradient and downgradient stream gauging site are selected, the discharge is determined at both sites and a water budget is computed. The results determine if the river corridor section is gaining, losing or showing no change in flow (Figure 25). Multiple types of stream channel exchanges may be occurring over the selected river segments; however, the streamflow analyses will yield the net change for a given segment without identifying if exchange processes in some sections of the segment differ from the net exchange. Water budgets are more complex when additional sources or losses of water occur within the study section (Figure 26). It is necessary to quantify flow measurement errors to determine if measured flow differences are significant (e.g., Healy et al., 2007) as discussed in Section 5 of this book.

Characterizing exchange at the valley-segment/river-corridor scale lumps conditions into the two streamflow discharge measurements. Exchange may vary as streamflow changes over time. If river corridors are dominated by losing streamflow, stream water recharge will enter the surrounding fluvial and upland geologic materials. Some of this water may be recirculated in the fluvial plain and discharge back to the stream channel in a downstream section of the stream. In other settings, water may enter a larger regional groundwater system and not return to the river corridor.