5.7 Seepage Meters
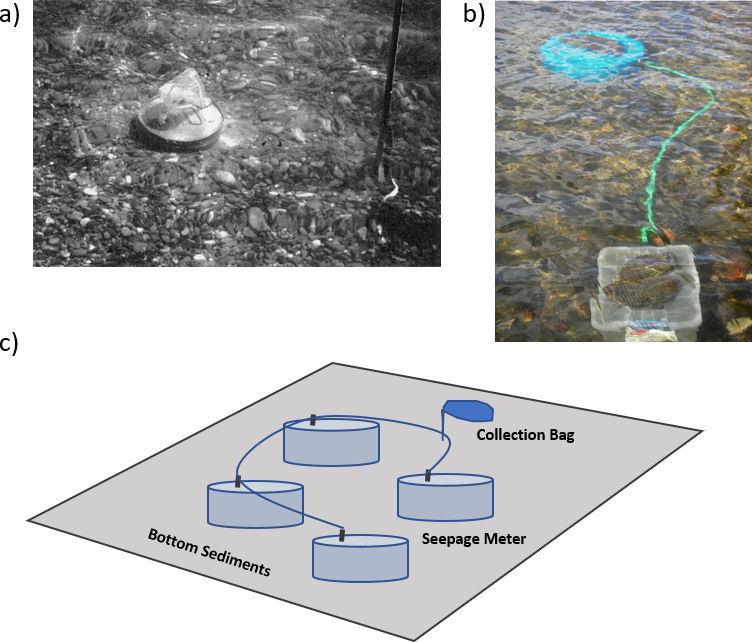
Seepage meters measure the flux of water between groundwater and a surface-water feature. Conceptually, a seepage meter is a container open at one end. It is often a 55-gallon (208-liter) drum with the open end pressed into the bed sediments so that it isolates water exchange. On its closed top a hole fitted with flexible tubing and a valve is present to which a thin-walled clear bag is attached (Figure 66). Exchange rates are computed by monitoring the change in bag volume over time and then dividing the value by the area of the bed the container covers. Rosenberry and others (2008) provide a detailed description of the design and use of seepage meters. Seepage meters have been used successfully in streams, lakes, wetlands and oceans. An excellent reference on seepage meter use and operation is the work of Rosenberry and others (2020) that addresses the history and evolution of seepage meters.
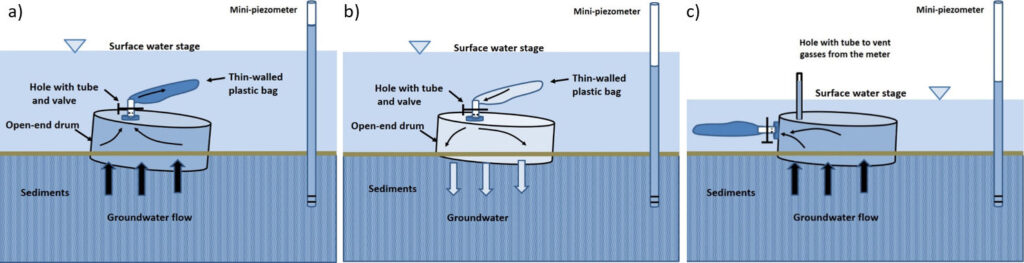
Seepage meters are often constructed from containers 10 to 100 cm in diameter sampling about 0.25 m2 or less of the bottom sediment (e.g., Rosenberry, 2005). They can be sized to meet anticipated site conditions. Natural sediment heterogeneities may result in a wide variation of seepage rates at a study site. In most cases, larger diameter meters are desirable because they integrate seepage over more of the bottom sediments being evaluated (e.g., Isiorho and Meyer, 1999). The standard seepage meter is operated by installing the drum, attaching a partially pre-filled, thin-walled bag sealed to a tube with a valve that is attached to the container (e.g. Israelsen and Reeve, 1944; Lee, 1977; Lee, 1972; Lee and Cherry,1978) (Figure 66 and Figure 67). The valve is opened and the change in water volume in the bag over time is measured. Based on the area of the meter, the flux (discharge per area) is computed. Seepage meters have been used to measure exchange in lakes (e.g., Lee and Cherry, 1978; John and Lock, 1977; Connor and Belanger, 1981; Erickson, 1981; Woessner and Sullivan, 1984; Isiorho and Matisoff, 1990; Shaw and Prepas, 1990b; Lesack, 1995; Rosenberry, 2000; Sebestyen and Schneider, 2001), stream channels (Lee and Hynes, 1977; Connor and Belanger, 1981; McBride, 1987; Libelo and MacIntyre, 1994; Blanchfield and Ridgeway, 1996; Jackman et al., 1997; Cey et al,1998; Fryar et al., 2000; Dumouchelle, 2001; Landon et al., 2001; Murdoch and Kelly, 2003); wetlands (e.g., Choi and Harvey, 2000) and ocean shorelines ( e.g., Shinn et al. 2002; Cable et al. 1997; Chanton et al, 2003; Taniguchi, 2002). Zamora (2008) provides a good summary of the seepage meter literature as does Rosenberry and others (2020). In lake and wetland settings, meter shape should not be a limiting factor. However, in flowing water conditions, such as streams and at tidally influenced coastlines, meters and collection bags are subjected to water flowing over the bag, a condition that has been shown to influence seepage results. Box 5 provides a more detailed discussion of seepage meter operation.
In some settings where seepage rates are typically low, interconnected ganged meter setups are used. This is accomplished by linking multiple meters to a single collection bag (Rosenberry, 2005) (Figure 67 C).
Seepage meters provide a direct measurement of flux for the area captured by the meter. The meter flux is assumed positive when the volume of the collection bag increases and negative when the volume decreases. The flux is computed as shown in Equation 4.
 |
(4) |
where:
| Q | = | discharge (L3/T) |
| A | = | area of the interface covered by the meter (L2) |
| q | = | flux (L3/(L2T)) |
| vol | = | net volume of water accumulated or lost from the collection bag (L3) |
| t | = | length of time the meter was operating once the valve was open until the measurement was completed (T) |
Seepage meter data can also be used to compute vertical hydraulic conductivity of the sediments in the vicinity of the meter when paired with a mini-piezometer. It should be noted that the mini-piezometer VHG can be locally influenced by the hydraulic properties of the sediment within which it is completed. Assuming steady state, and isotopic and homogeneous conditions, the vertical hydraulic conductivity can be calculated as shown in Equation 5.
 |
(5) |
where:
| Kv | = | vertical hydraulic conductivity (L/T) |
| q | = | seepage meter flux (L3/(L2T)) |
| i | = | VHG measured by mini piezometer and entered as a negative value (L/L) |
Groundwater velocity (v) at the meter site can also be computed when a measurement or estimate of the sediment effective porosity (n) is available as expressed in Equation 6.
 |
(6) |
where:
| v | = | vertical groundwater velocity (L/T) |
| n | = | effective porosity (L3/L3) |
| i | = | VHG measured by mini piezometer and entered as a negative value (L/L) |
Seepage meters are most often deployed in shallow water settings and deployed manually by wading or diving. Deeper water installation requires the use of diving equipment to set up a meter and collect data. Cherkauer and McBride (1988) employed a deep-water meter that was lowered to the bottom from a boat. An electronic valve started and stopped meter flow, which entered a tube that carried water to a collection bag located at a float near the water surface. Boyle (1994) also described the design of a deep-water meter deployed in a boreal forest lake.
Another challenge of using the seepage meter is that each time a measurement is taken the collection bag needs to be physically removed and re-installed under water. As a result, researchers developed other flow measuring methods to eliminate the need for the collection bag. Early approaches included a remotely deployed meter that used thermal perturbation methods to measure flows (Taniguchi and Fukuo, 1993). Paulsen and others (2001) developed a submarine seepage meter with an ultrasonic flow meter that measured both forward and backward flow. Data were logged with a tethered data logger. The United States Navy developed a deep water seepage meter, Ultra Seep, that is lowered to the bottom using a boat and cable (Figure 68a). It has a self-contained recording ultrasonic flow meter. The meter also collects geochemical data and is equipped to obtain water samples. The United States Geological Survey developed a seepage meter with an electromagnetic flow meter (EFN) that requires external power (Rosenberry and Morin, 2004) as shown in Figure 68b. The EMF meter records rates from 30 ml/min to 30 L/min and works well in both shallow- and deep-water environments.

Seepage meters are rarely used in surface-water features with bedrock bottoms, as meters cannot be adequately seated. However, bedrock seepage meters (BSM) have recently been installed in the sedimentary bedrock stream bottom of the Eramosa River in Guelph, Ontario, Canada (Kennedy, 2017). In this study, meters were 5 cm in diameter placed in a hole that was 0.1 m deep bored in the bedrock using a portable concrete drill. The open borehole was outfitted with a low-profile expandable plug (J plug packer) containing a tube and valve as shown in Figure 69 (Kennedy, 2017). Seepage rates at this site were reported to be controlled by the presence or absence of fractures in or adjacent to the bore (e.g., Kennedy, 2017). Preliminary results are promising.

Exchange studies using seepage meters often deploy a number of meters with the anticipation that seepage patterns will be complex. Studies of seepage in lakes have often found higher seepage rates associated with the littoral zone and near shore areas; rates decreased with distance from the lake shoreline as noted in Figure 39 (e.g., McBride and Pfannkuch, 1975). However, sometimes zones of higher seepage rates are found farther from a shoreline. Toran and others (2014) collected two-dimensional electrical resistivity data and seepage meter data along a lake transect and evaluated the correlation of resistivity data and seepage rates. They concluded that detailed seepage patterns were poorly resolved with resistivity data. Seepage rates are also expected to vary with time. Seepage is dynamic, and measurements over time are recommended.
The seepage meter can also be used to collect a sample of the seepage water when groundwater is discharging to the surface-water feature. This is accomplished by allowing sufficient time for the surface water trapped during meter installation to flush from the meter. Then, a clean deflated bag is installed to collect a water sample once the valve is open.