Solution to Exercise 1
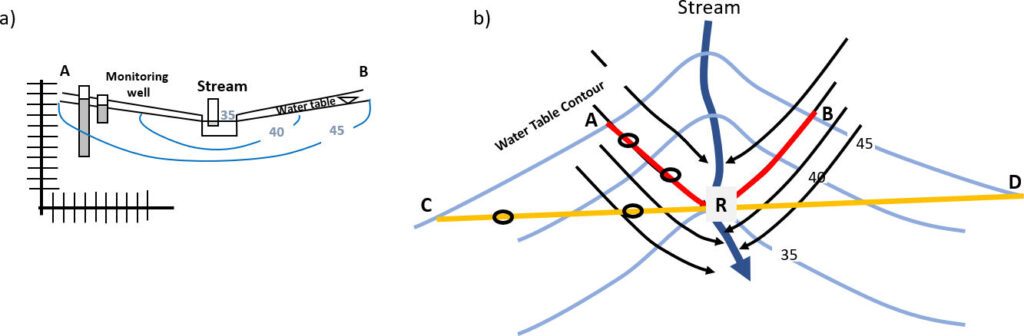
1) The conceptual models presented in this book keep conditions simple by using a constant value for hydraulic conductivity, cross sections aligned with groundwater flow lines and cross sections plotted without vertical exaggeration. Examine Figure Exercise 1 below. The cross section in Figure Exercise 1a, is constructed parallel to flow, as indicated by red line (A-R-B). Under the conditions illustrated in Figure Exercise 1, think about the consequences of using head data to interpret the flow field from a cross section constructed at right angles to the stream as indicated by the line C-R-D. To make the comparison use A-R and C-R. Explain why the cross section along line A-R correctly represents horizontal and vertical groundwater flow, but head and flow data in a cross section along C-R does not appropriately represent flow conditions.
SOLUTION:
Construction of the cross section along a flow line (A-R of Figure Exercise 1) results in the flow of groundwater within and parallel to the cross section. The cross section is a slice of the groundwater system and for the head and equipotential lines to be accurately represented the flow must be in the plane of the cross section (see A-R below). Thus, under isotropic and homogeneous conditions, flow lines plotted on the map and cross section will cross the equipotential lines at right angles. If flow conditions are anisotropic, they will cross the equipotential lines at the appropriate angle as discussed in the Groundwater Project book titled Hydrogeologic Properties of Earth Materials and Principles of Groundwater Flow.
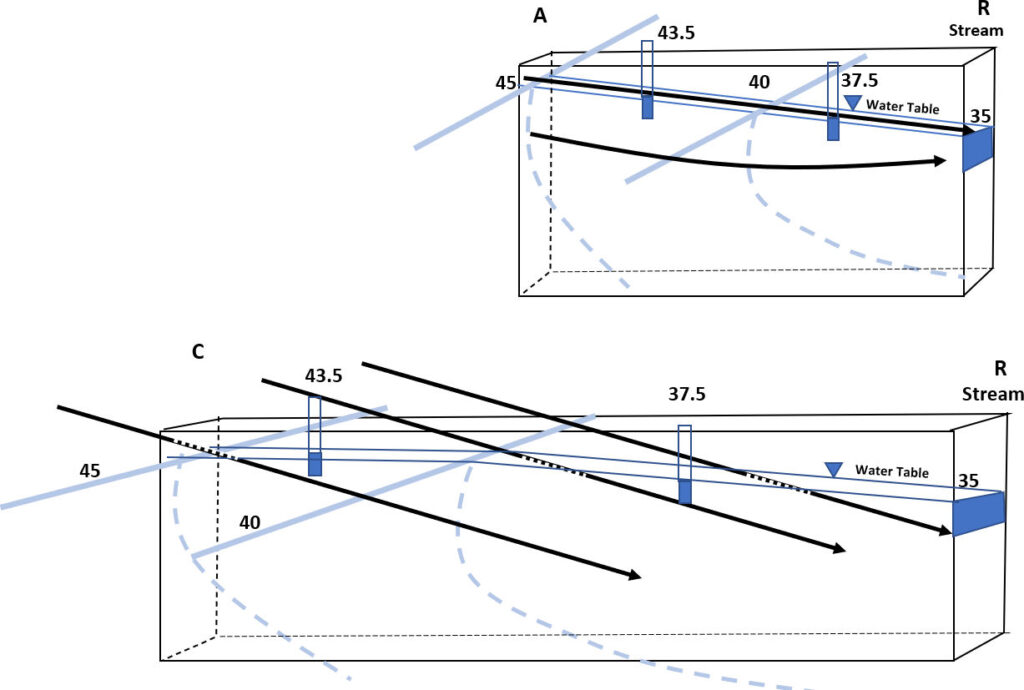
Cross section A-R is plotted parallel to the flowlines so flow within the cross section is at right angles to the equipotential lines and head values at monitoring wells are evenly spaced.
Cross section C-R is plotted at a right angle to the stream, so it crosses flowlines which means that flow moves in and out of the section (dashed portions of black lines in the cross section). Also, the head change from 45 to 35 occurs over a longer distance than in A-R so the head distribution (lower gradient) is not representative of a section constructed parallel to flow. Since the flow is not parallel to the cross section (i.e., along line C-R) the distribution of head and the position of the flow lines will not be properly represented. Using the head values obtained along this section will yield gradients that are not representative of flow along a flowline
It some cases it may be appropriate to place wells at right angles to streams to compute gradients and interpret vertical flow conditions. However, if groundwater flow to and from the stream channel occurs at some angle to the stream channel additional monitoring points are needed so that a cross section along a flow line can be constructed. When these conditions are met, vertical and horizontal flow conditions within a cross section will be correctly represented.