Solution to Exercise 4
4) A water budget for a shallow subtropical lake found surface-water drainage canal discharges (34%), direct precipitation (24%) and groundwater discharge (14%) dominated inflows. Water left the lake by sheet flow into a swamp (65%), evaporation (34%), and groundwater outflow (1%). Nitrogen loading to the lake was also a concern and the lake was classified as dystropic, (chronic hypoxia and high concentrations of unionized ammonia). Groundwater was computed to deliver 48% of the load. Restoration efforts were initiated in 1996 and included removal of organic sediment, dredging and planting of native vegetation. Additional nitrogen reduction restoration is needed. The lake is in a depression created by limestone dissolution. A seepage study of the lake was conducted using twenty 208-liter seepage meters and mini-piezometers installed next to each meter (Figure Exercise 4). Meters were installed and seepage rates measured every 14 days from October through mid-May. Meters 1-14 were located in the littoral zone and 15-20 were in open water. Meters equilibrated for three months before study operation. Bags were prefilled with 1000 ml of deionized water for each seepage event. Mini-piezometers were placed in holes excavated into the bed sediment and bedrock and backfilled with sand and bentonite. Water quality samples were taken from the mini-piezometers. Mean seepage rates and total nitrogen concentrations were computed for each of the twenty sites (Table Exercise 4).
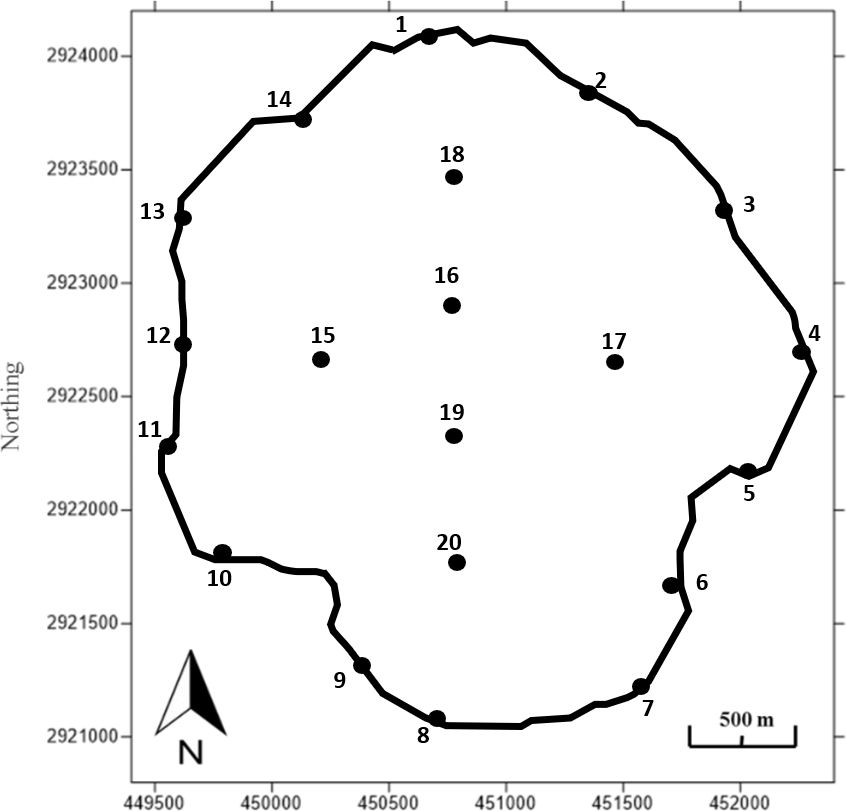
Table Exercise 4 – Mean Seepage Rates and Mean Total Nitrogen Concentrations of Discharging Groundwater in a Shallow Lake. Positive seepage values represent groundwater inflow. Site numbers represent both seepage meters and the adjacent mini-piezometer (Lucius, 2016).
| Site | Northing | Easting | Mean Seepage (L/m2/d) | Mean Total Nitrogen (mg/l) |
| 1 | 450593.39 | 2924113.61 | 1.44 | 11.84 |
| 2 | 451291.49 | 2923858.38 | 0.26 | 17.7 |
| 3 | 451916.45 | 2923324.12 | 1.74 | 9.06 |
| 4 | 452238.73 | 2922714.82 | 1.16 | 4.38 |
| 5 | 451989.45 | 2922144.28 | 0.15 | 20.32 |
| 6 | 451695.94 | 2921673.69 | 0.2 | 17.1 |
| 7 | 451520.61 | 2921227.23 | 0.89 | 4.55 |
| 8 | 450647.05 | 2921081.35 | 7.04 | 5.45 |
| 9 | 450321.19 | 2921294.35 | 0.59 | 5.64 |
| 10 | 449740.75 | 2921801.64 | 0.14 | 13.02 |
| 11 | 449481.89 | 2922268.64 | 1.85 | 4.16 |
| 12 | 449533.30 | 2922725.53 | -0.08 | 6.01 |
| 13 | 449535.09 | 2923278.14 | 0.25 | 4.74 |
| 14 | 450033.85 | 2923738.93 | 0.83 | 6.49 |
| 15 | 450155.54 | 2922664.82 | 0.89 | 52.28 |
| 16 | 450716.41 | 2922891.76 | 0.67 | 28.53 |
| 17 | 451418.80 | 2922658.34 | 0.87 | 24.27 |
| 18 | 450717.27 | 2923464.25 | 1.02 | 11.24 |
| 19 | 450717.90 | 2922308.40 | 3.11 | 23.78 |
| 20 | 450725.32 | 2921747.50 | 2.11 | 6.46 |
SOLUTION:
a) Plot the mean seepage data on the location map and contour it using an interval of 0.5 L/(m2d). Where is the seepage concentrated? Is water seeping from the lake to the groundwater? Would you classify the lake as effluent, influent, flow-through, or mixed? Support your answer.
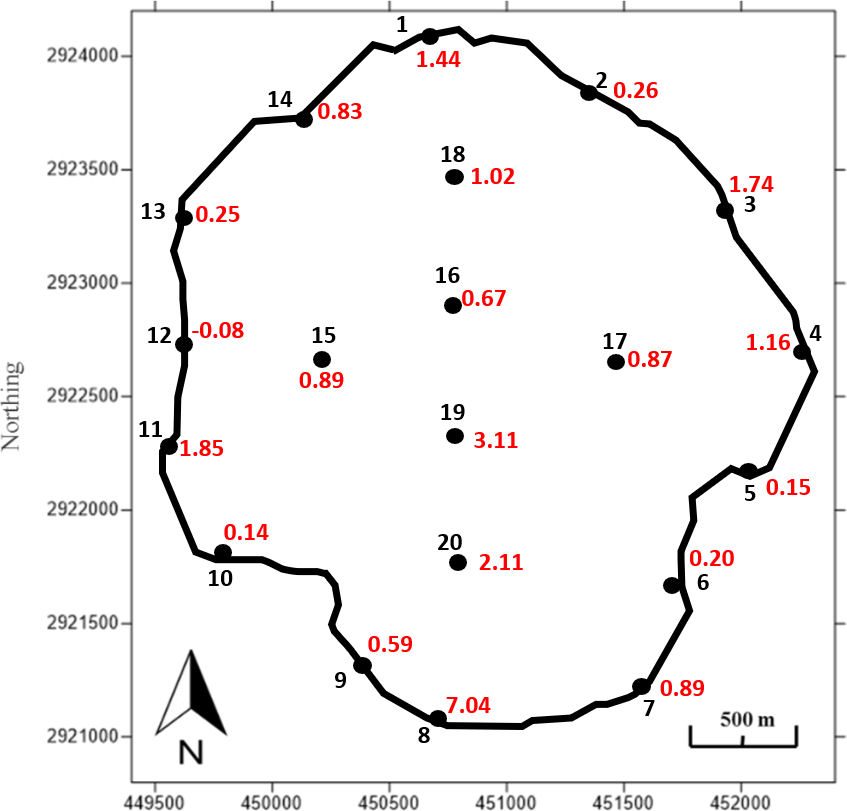
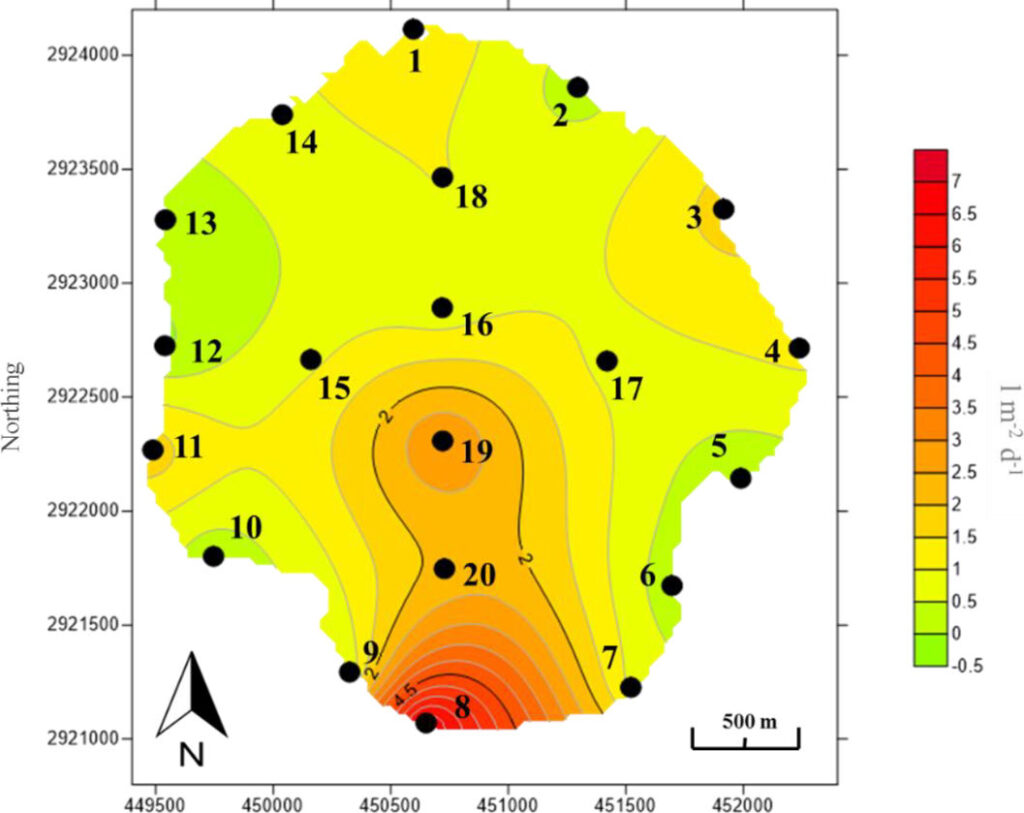
The seepage is concentrated in the southern portion of the lake bottom and shore line, 8, 20, 19. The lake is receiving groundwater discharge at all monitored locations except for the region at site 12 where water was found seeping from the pond (negative seepage, low rate). The lake would be classified as effluent or a gaining lake as seepage rates are positive at the shoreline and in the main part of the lake.
b) Plot the mean total nitrogen data on a second copy of the location map. Use a contour interval of 2 mg/l. Where are the concentrations of total nitrogen the highest? Do they correspond with the highest groundwater seepage rates?
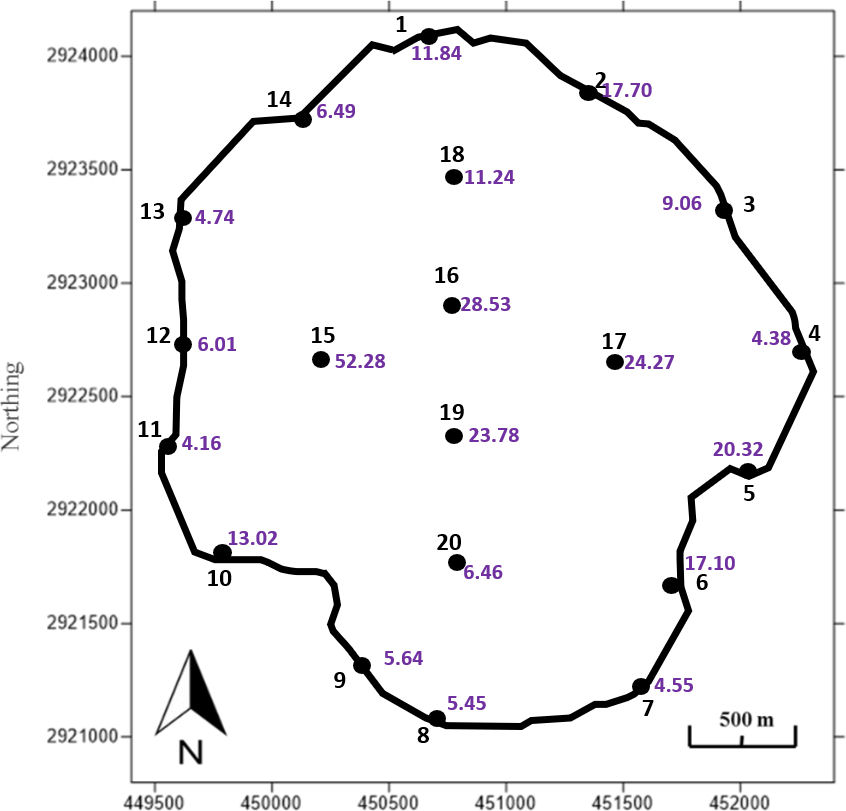
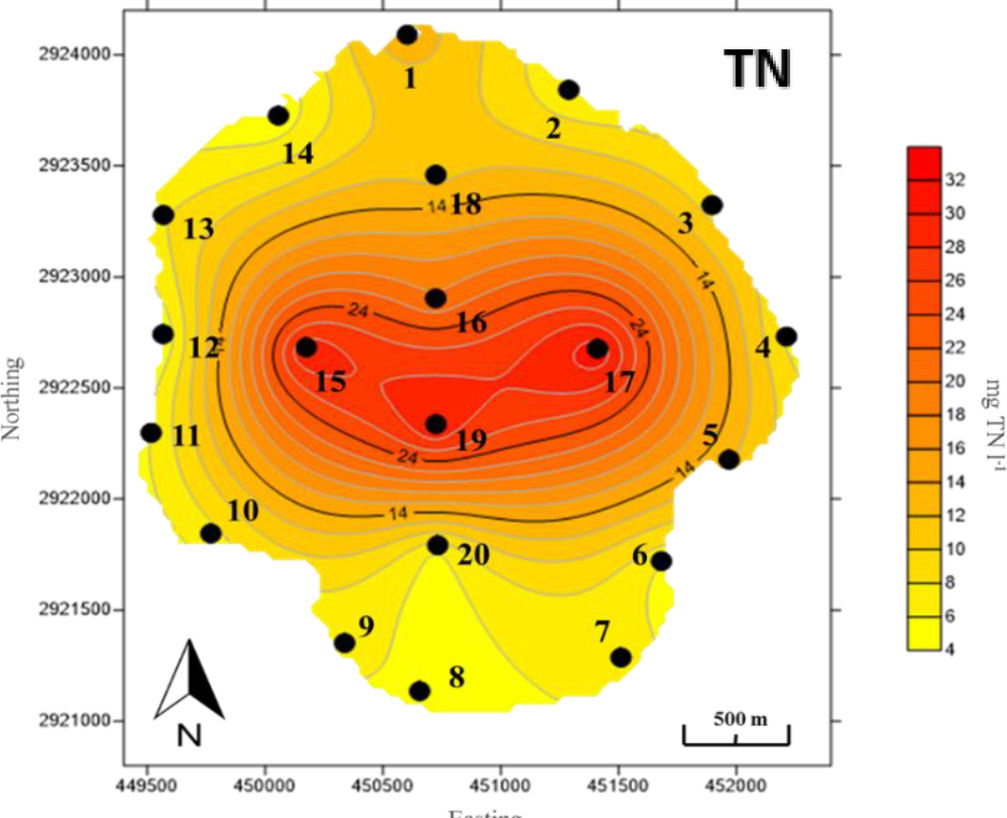
The highest total N concentrations are found in the central area of the lake, 19, 15 and 17. These locations had relatively high seepage rates; however, the total nitrogen concentration was relatively low at location 8 where the highest mean seepage rate was recorded.
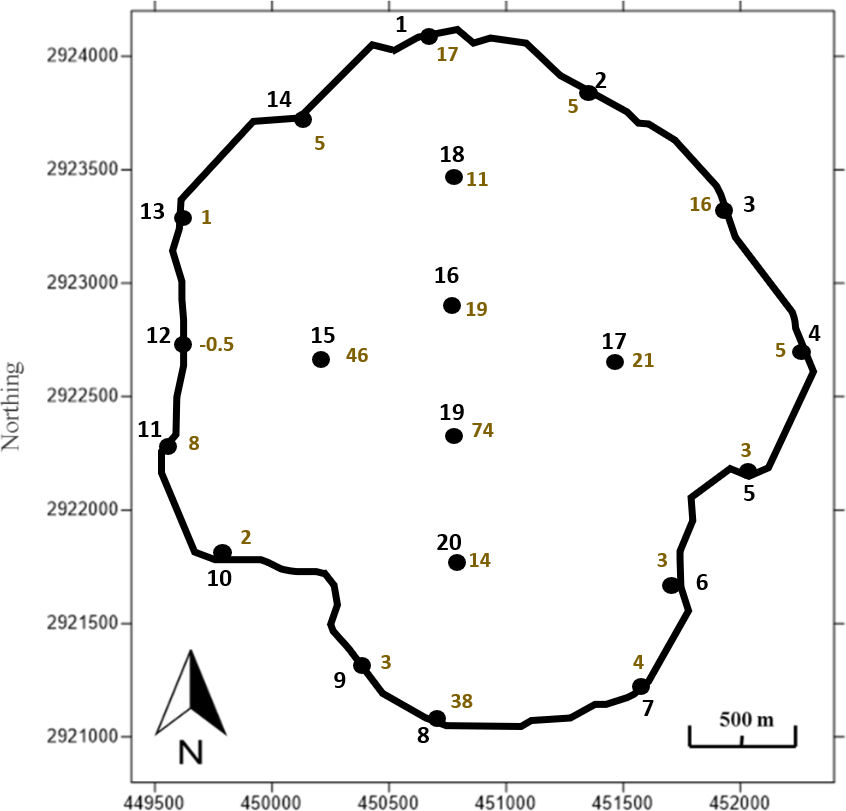
c) Compute the mean total nitrogen loading at each location and contour the data. Use a contour interval of 20 mg/(m2d). Discuss how mean seepage meter and mini-piezometer mean water quality data can be used to target nitrogen reduction remediation efforts. Think about what other hydrogeologic information is needed to accomplish remediation goals (big picture).
The total loading in units of mg/m2d were computed by multiplying the mean seepage rate and mean total N loading values in the table.
| Site | Mean Tot N Load mg/m2/d |
| 1 | 17 |
| 2 | 5 |
| 3 | 16 |
| 4 | 5 |
| 5 | 3 |
| 6 | 3 |
| 7 | 4 |
| 8 | 38 |
| 9 | 3 |
| 10 | 2 |
| 11 | 8 |
| 12 | -0.5 |
| 13 | 1 |
| 14 | 5 |
| 15 | 47 |
| 16 | 19 |
| 17 | 21 |
| 18 | 11 |
| 19 | 74 |
| 20 | 14 |
The table values were rounded to the nearest whole number with the exception of the negative value at site 12. Values were plotted at the locations shown on the map and then hand contoured using linear interpolation.
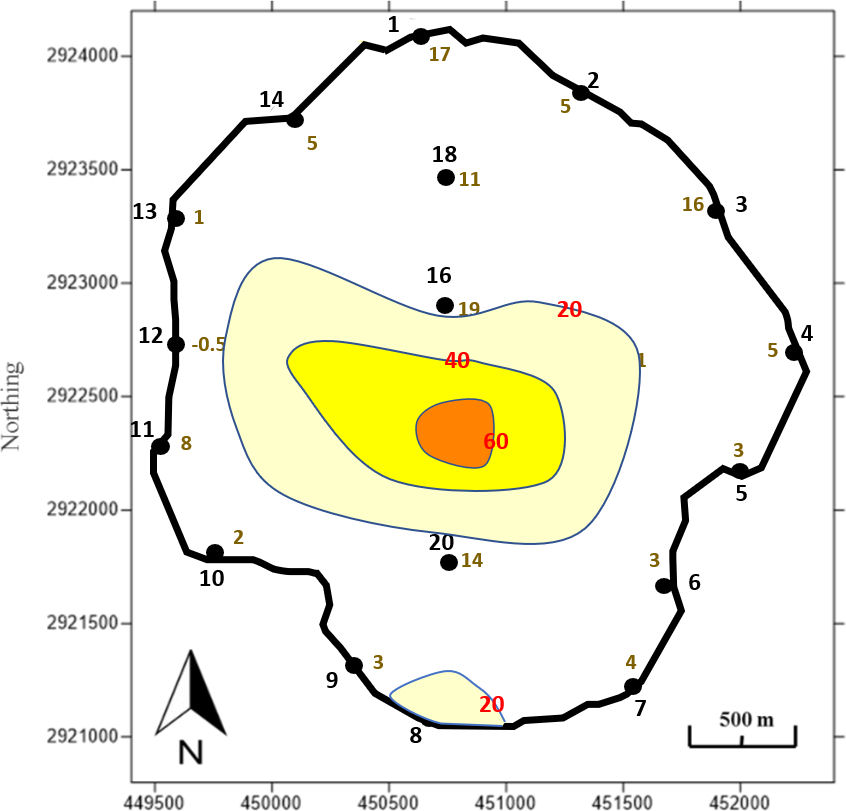
Total nitrogen loading is concentrated in the center of the lake where groundwater concentrations of total nitrogen were high and seepage rates were also elevated. Loading also occurred in the vicinity of location 8, principally because groundwater seepage rates were high even though total nitrogen concentrations were only 6.43 mg/l. Nitrogen reduction efforts should focus on the source area of groundwater that seeps into the central part of the lake. Additional monitoring wells are needed to identify the groundwater flow paths in the vicinity of the lake so that pathways from the lake central area can be traced up gradient to the source. Sources of nitrogen encountered between the recharge area and source area can be identified and an evaluation made to see if the total nitrogen entering the system can be reduced. Other approaches might include engineering controls such as reducing the rate of nitrogen rich seepage to the lake by capturing and treating the groundwater before it reaches the lake.