4.2 Segment Flow Systems
The Colorado River in Austin creates the lowest topographic point in the aquifer. It separates the Northern and Barton Springs segments. As illustrated in Figure 12, the Colorado River and its contiguous channel are characterized as hydraulically isolated from the Edwards Aquifer. In Austin, the river receives flow from Barton and Cold Springs on the southern bank and Deep Eddy Springs (northern bank) as well as smaller springs and streams, but the Colorado River does not recharge the aquifer in a meaningful way. Hence, surface water and groundwater flow in the greater Colorado River watershed are hydraulically separate from the Edwards Aquifer. In times of severe drought, the groundwater divide between the San Antonio and Barton Springs segments can disappear and the two segments essentially become one (Smith et al., 2012).
To the west of the San Antonio and Kinney segments, the Devils River watershed discharges from the Edwards-Trinity Aquifer via major springs in the Devils River channel and elsewhere (San Felipe) and to the Rio Grande (Green et al., 2019c). Goodenough Spring, historically the third largest spring in Texas (Brune, 1975; Kamps et al., 2009), is an example of the springs that discharge to the Rio Grande. Springs that are not associated with the Devils River catchment are considered part of the Del Rio pool.
The following subsections summarize the flow systems of the four segments as defined in Figure 2 and Figure 12.
4.2.1 The San Antonio Segment
This segment is the largest of the four segments and extends from a groundwater divide in Kinney County in the west to the groundwater divide with the Barton Springs segment in Hays County (Schindel, 2019). There are two defined pools in the San Antonio segment: the Uvalde and San Antonio pools (Figure 26). More detailed descriptions of the San Antonio segment are provided by Lindgren and others (2004) as well as Green and others (2019a,b). Surface water and groundwater in the San Antonio segment eventually discharge to rivers that flow to the Gulf of Mexico. Surface water and groundwater to the west of the San Antonio segment, including the Kinney segment, discharge to the Rio Grande which also ultimately flows into the Gulf of Mexico.

Figure 26 – Conceptual model of sources of groundwater input and loss for the San Antonio and Kinney segments of the Edwards Aquifer (Green et al., 2019a).
Domains of the San Antonio segment numerical groundwater models (Klemt et al., 1975; Maclay and Land, 1988; Lindgren et al., 2004; Lindgren, 2006; Liu et al., 2017) included the recharge and confined zones of the Edwards Aquifer whereas the model domain by Fratesi and others (2015) included the contributing zone of the Edwards Aquifer. Although models of the San Antonio segment (i.e., Klemt et al., 1979; Maclay and Land, 1988; Lindgren et al., 2004; Fratesi et al., 2015; Liu et al., 2017) and the Edwards-Trinity Aquifer (Anaya and Jones, 2004, 2009; Young et al., 2009; Hutchison et al., 2011b) covered at least part of the Edwards Aquifer in Kinney County, only the model by Hutchison and others (2011a) was developed exclusively for the Kinney County portion of the Edwards Aquifer.
Groundwater flow in the contributing and recharge zones of the San Antonio segment has been characterized as essentially north-south in the Uvalde and western San Antonio pools but shifts to northwest-southwest in the central San Antonio pool and to west-east in the eastern San Antonio pool. The Groundwater Availability Model for this segment (Lindgren et al., 2004; Liu et al., 2017) shows groundwater flow in the recharge zone is essentially downdip (Figure 27 and Figure 28), although the direction of flow varies to some degree among the fault blocks. Groundwater flow in the confined zone of the San Antonio segment is essentially parallel to the fault strikes—from west-east in the western and central portions of the San Antonio pool to southwest-northeast in the eastern portion of the segment.

Figure 27 – Simulated flow system for the San Antonio segment for above-normal rainfall conditions (modified from Lindgren et al., 2004). Red lines are simulated karstic conduits.
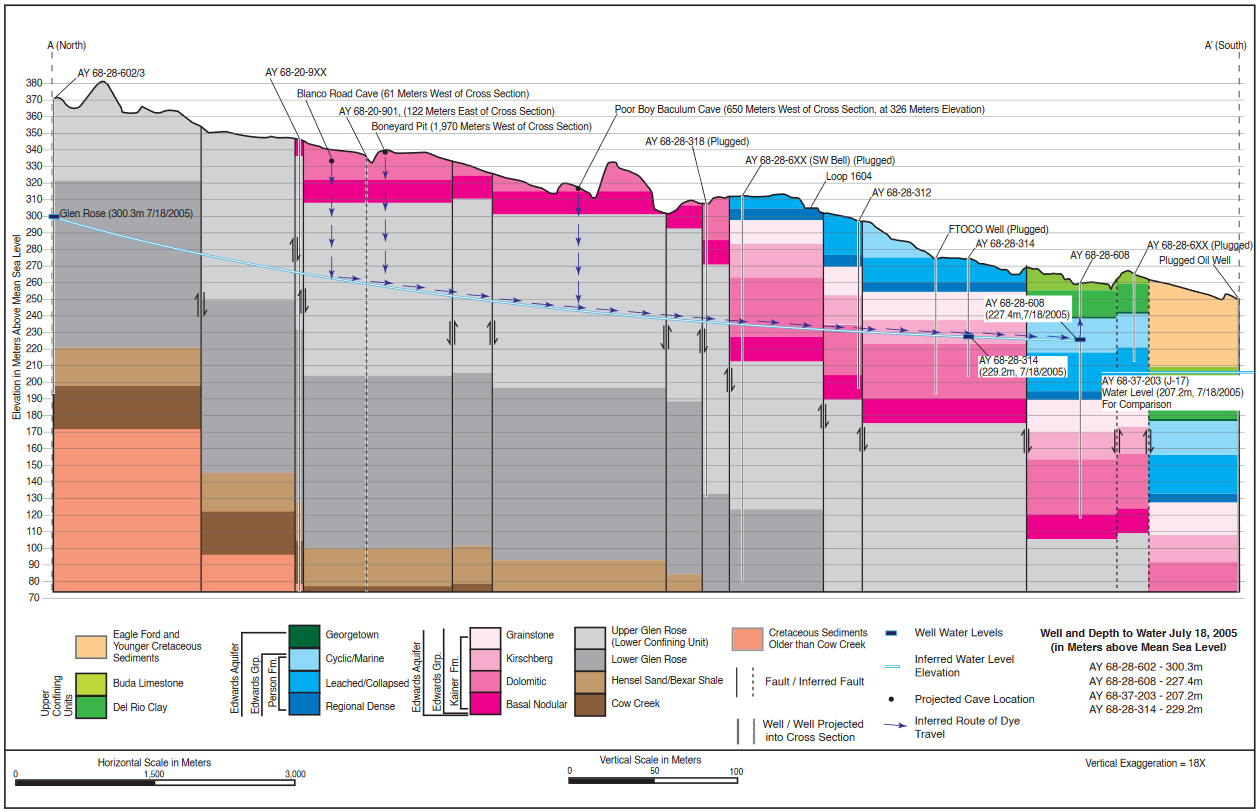
Figure 28 – A cross section through the Edwards Aquifer, Bexar County, showing that the Upper Glen Rose acts as part of the Edwards Aquifer in this area (Johnson et al., 2010). The location of this cross section is shown in Figure 12.
4.2.2 Barton Springs Segment
The Barton Springs segment extends from the groundwater divide with the San Antonio segment in Hays County to the Colorado River. Detailed descriptions are found in Scanlon and others (2001) and Hunt and others (2019). The domains of the Barton Springs segment numerical groundwater models by Scanlon and others (2001, 2003), Smith and Hunt (2004), Winterle and others (2009), and Hutchison and Hill (2011) were essentially the same. All were porous media models except Winterle and others (2009) who attempted to account for karst conduit/diffuse flow using MODFLOW-DCM (Painter et al., 2007). Groundwater flow in the Barton Springs segment has been extensively characterized using tracer testing as shown in Figure 29 (Hauwert, 2004; Johnson et al., 2012; Hunt et al., 2019, and Zapitello et al., 2019). Flow in the contributing and recharge zones is generally west-east and, like the San Antonio segment, is essentially downdip. Similarly, flow in the confined zone is essentially from the south and west to the northeast, parallel to fault strikes, where it discharges primarily to four springs: Barton Springs Main (Figure 9); Upper Barton Springs ; Eliza Springs (video and Figure 10); and Old Mill Springs. Tracing studies have delineated flow systems shown in Figure 29. The Cold Springs pool receives most of its recharge from the Barton Creek catchment and discharges to the Colorado River at Cold Springs. Other smaller springs discharge an undetermined small amount directly to the Colorado River. The Sunset Valley system discharges at Main and Upper Barton springs and perhaps also at Cold Springs. The Manchaca system discharges to all four of the Barton Springs. The location of the groundwater divide separating the Barton Springs segment from the San Antonio segment has been characterized as variable. It migrates between Onion Creek and the Blanco River depending on local head conditions (Smith et al., 2012).
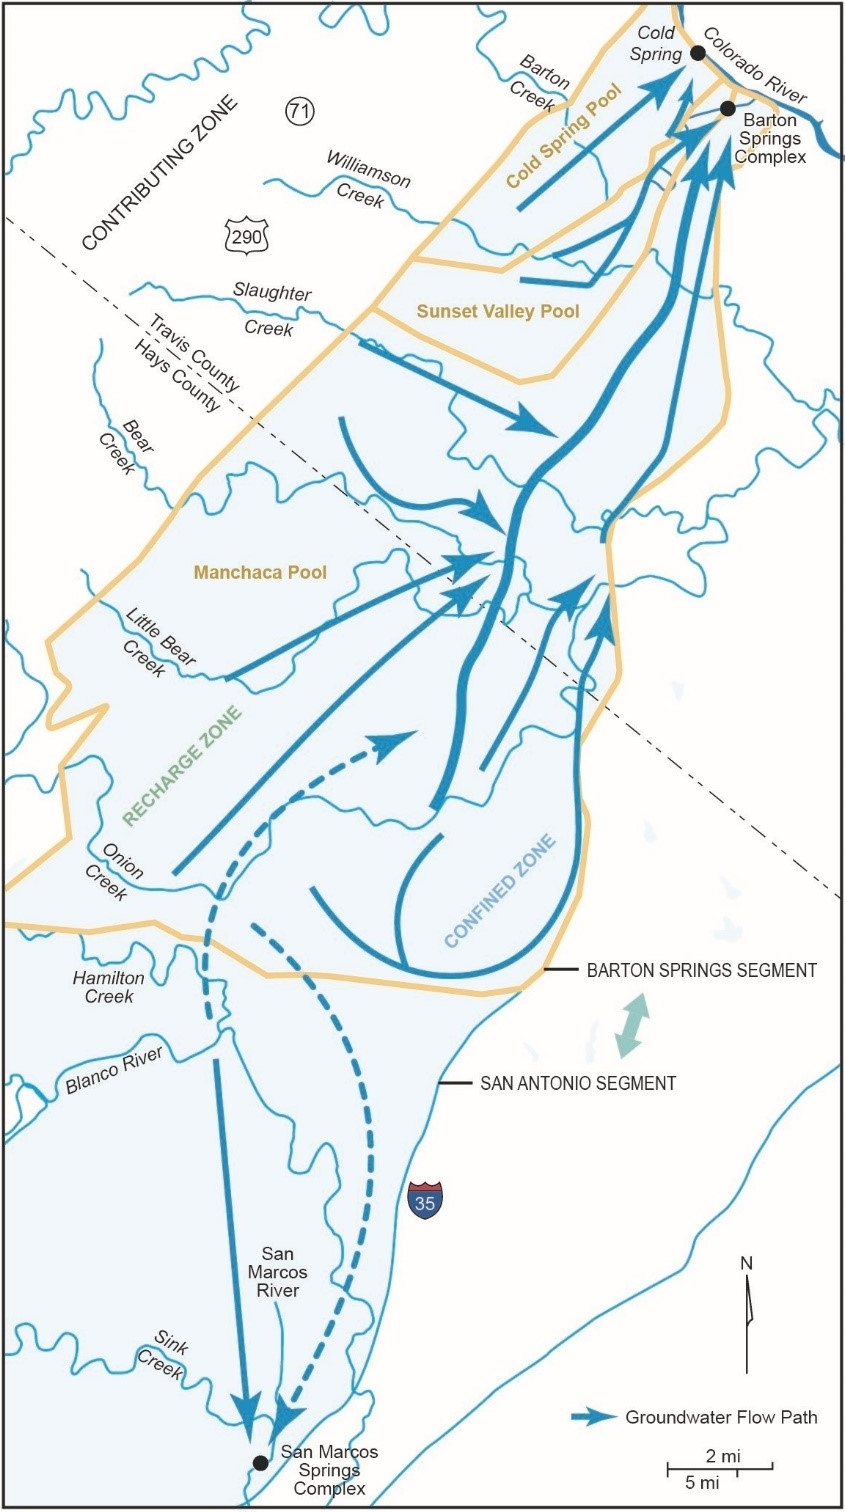
Figure 29 – Barton Springs segment pools and flow paths defined by tracer tests (Zapitello et al., 2019). The Cold Spring pool doesn’t discharge directly to Barton Springs, whereas the Sunset Valley and Manchaca pools do. The boundary (groundwater divide) between the Barton Springs and San Antonio segments shifts under different aquifer conditions and in some cases disappears. The dashed flow paths represent groundwater tracing results that crossed the boundary. The divides between all the pools may also shift under different aquifer conditions (Hauwert, 2009).
4.2.3 Northern Segment
The Northern segment extends from the Colorado River in the south to Bell County in the north where the aquifer strata thin out (Figure 2 and Figure 12). The Northern segment of the Edwards Aquifer is not hydraulically contiguous with the Washita Prairies Aquifer located farther to the north (Yelderman, 2019). Jones (2003, 2019) provides more detailed descriptions of the Northern segment. Similar to the Barton Springs segment, groundwater flow in the contributing and recharge zones of the Northern segment is west-east as shown in Figure 30 (Senger et al., 1990; Jones, 2006). Once recharged, flow in the confined zone in the northern portion of the segment discharges at Salado Springs and other springs. Groundwater flow in the southern portion of the segment discharges to the Colorado River. One of the defining characteristics of the Northern segment is the fact that recharge occurs in the uplands and minor streams, while major streams are often sites of spring discharge (Kreitler et al., 1987; Smith et al., 2005a).
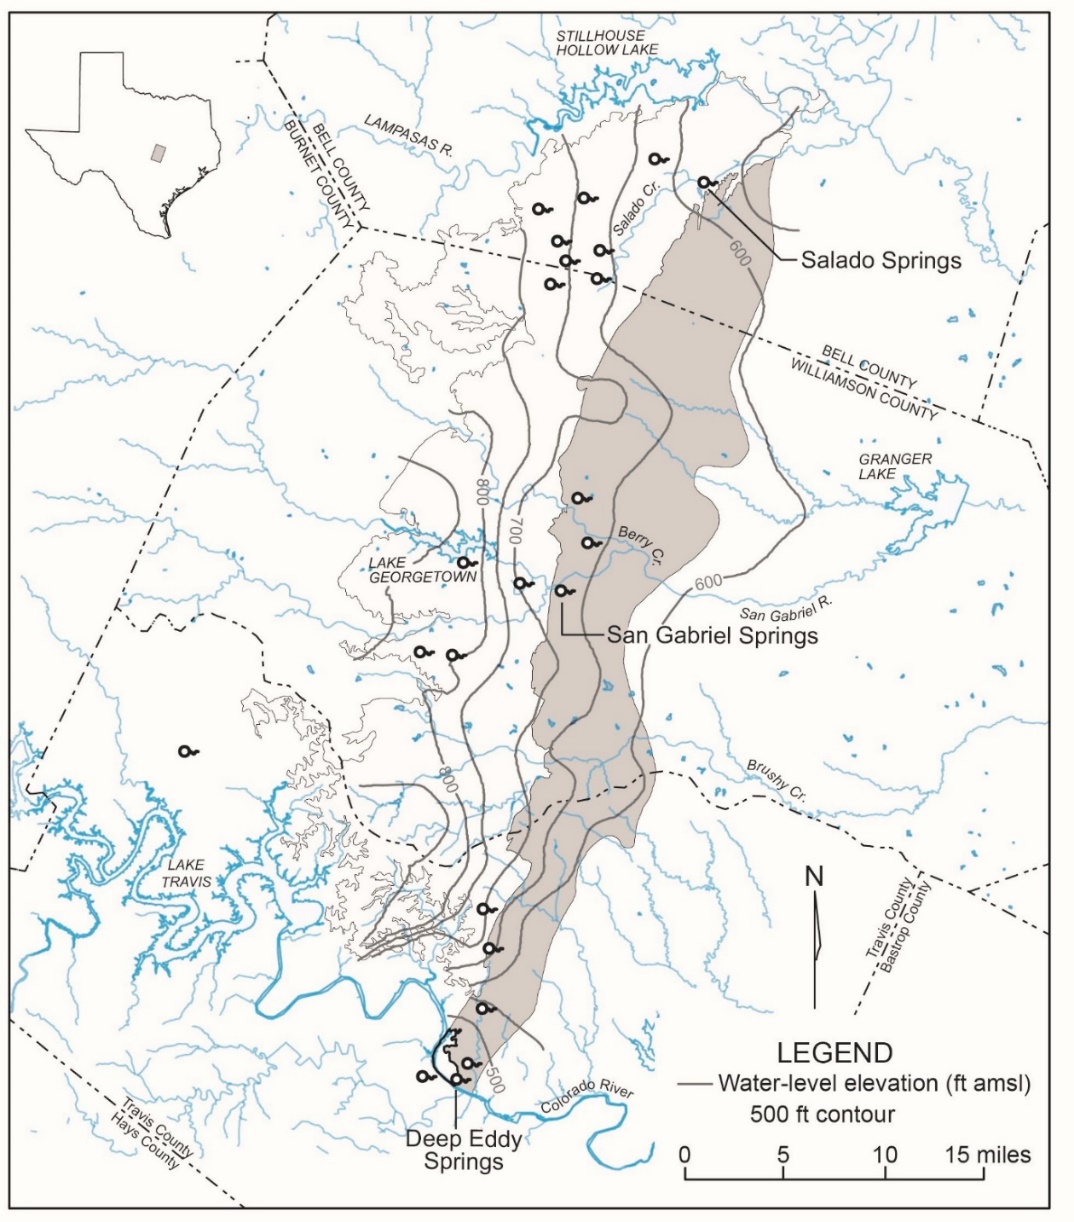
Figure 30 – Steady-state water-level elevations for the Northern segment flow system showing major springs (modified from Jones, 2003). The shaded area is the confined zone (modified from Jones, 2003). 1 mile = 1.6 kilometers.
4.2.4 Kinney Segment
The Kinney segment extends from a groundwater divide located between Mud Creek and Pinto Creek on the west to an effective structural, hydraulic barrier near the Kinney County and Uvalde County line (Figure 2 and Figure 12). The barrier is a result of natural dewatering of the permeable portion of the Edwards Aquifer (i.e., Salmon Peak) in eastern Kinney County due to structural uplift. Consistent with the geologic structure and supported by tracer testing (Johnson and Schindel, 2015), groundwater flow within the segment is northeast-southwest as shown in Figure 31. Differences in magnesium concentrations (Figure 32) and other constituents (e.g., sulfate) in groundwaters in Kinney and Uvalde counties support the interpretation that groundwater in the Kinney segment is distinct from the Uvalde pool. Based mostly on water chemistry and geologic structure, it is expected that during periods of low to average groundwater elevation groundwater in the Edwards Aquifer will not flow from Kinney County to Uvalde County, but limited flow from west to east may be possible when groundwater elevations are high. Natural discharge from the Kinney segment occurs as spring discharge and underflow through the floodplains of Pinto and Las Moras creeks at the southern (downdip) boundary of the segment.
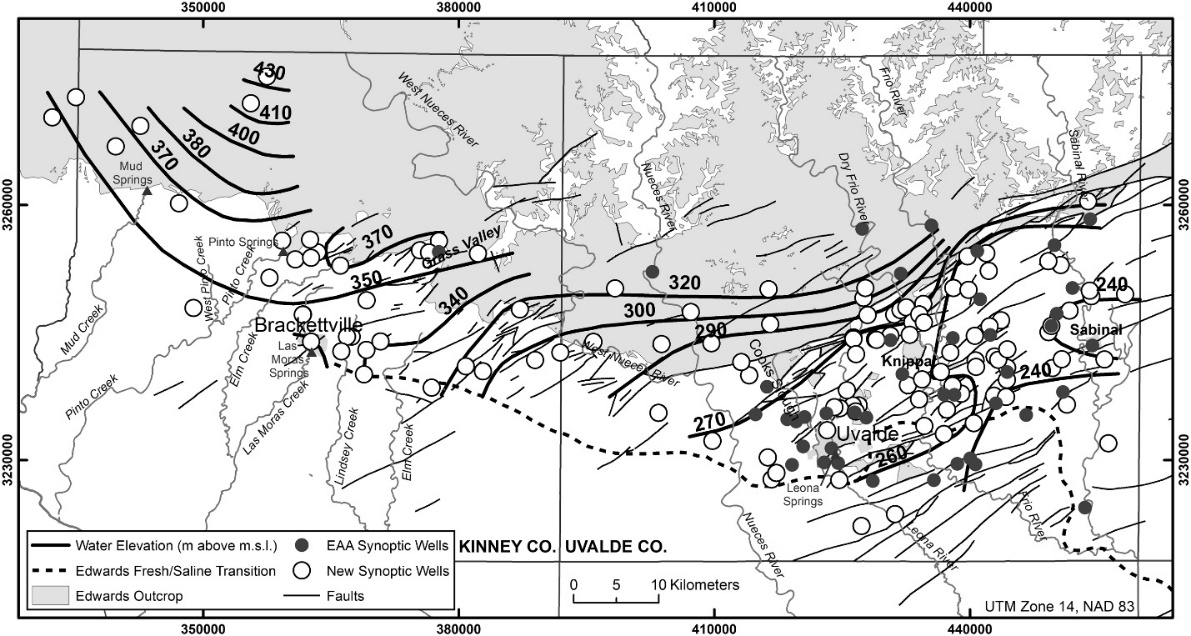
Figure 31 – Potentiometric surface of the western Edwards Aquifer in January/February 2006 (Green et al., 2019d). Coordinates are in Universal Transverse Mercator (UTM) Zone 14, North American Datum 1983 (NAD 83); msl is mean sea level; EAA denotes Edwards Aquifer Authority.
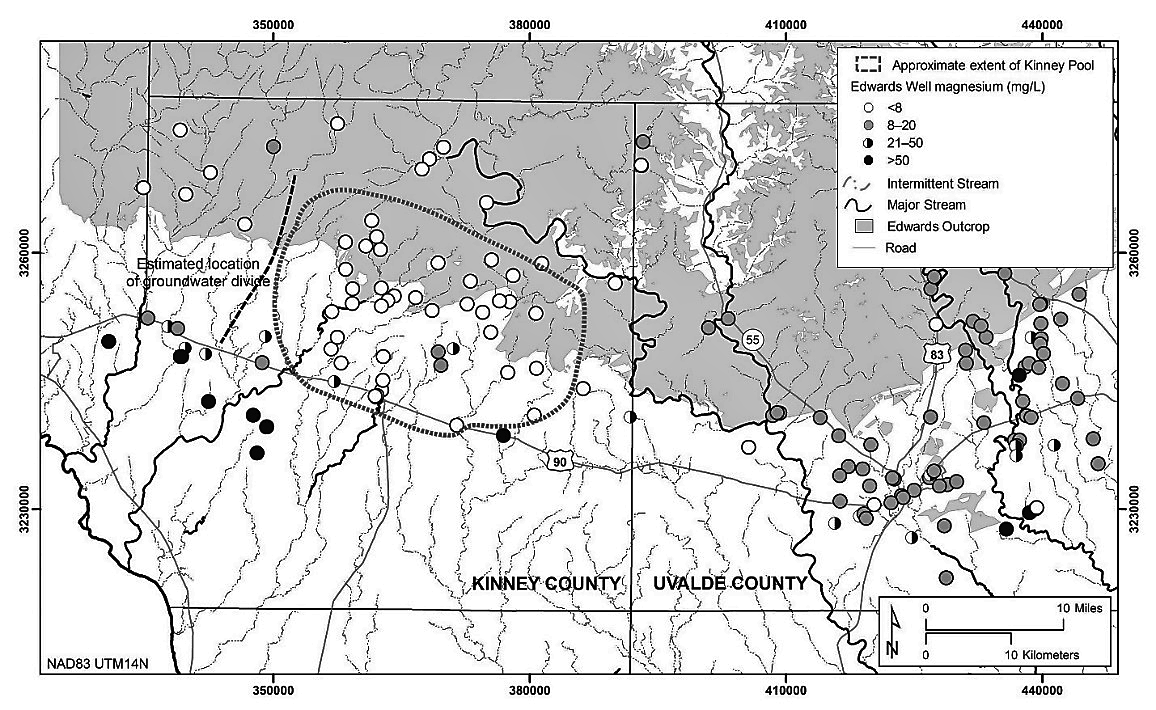
Figure 32 – Map showing the approximate location of the Kinney Pool and measured concentrations of magnesium in Edwards Aquifer wells in mg/L (Green et al., 2019d). Coordinates are in Universal Transverse Mercator (UTM) Zone 14, North American Datum 1983 (NAD 83).