6 Example of Anthropogenic Land Subsidence Calculation
We provide herewith a practical example of calculation of land subsidence due to groundwater withdrawal. Data are taken from Venice, Italy, which experienced an important anthropogenic land settlement in the second half of the twentieth century, and are summarized in Gambolati (1972). The data needed for the calculation are of two kinds. The first type comprises litho‑stratigraphy of the subsoil down to the depth of interest (that is, the depth where drawdown has occurred) along with the mechanical and hydraulic properties of each stratum (considered to be homogeneous); the second type addresses the history of the piezometric decline experienced in the permeable (that is, sandy) formations from which the wells pump. Table 2 shows the simplified litho‑stratigraphy of the Venice area down to about 300 m depth. The compactable thickness, which differs in some cases from the total thickness, takes account of layers of sand, which are much stiffer than the layers of clay that incorporate them. Table 2 includes several aquifer levels that appear frequently in the sedimentary sequence at various locations in Venice. We refer particularly to layers 2, 4, 6, 8, 11 and 13, which are composed predominantly of sands and which host most of the pumping well intakes as well as the borehole piezometers. Of course, a more accurate subdivision of the litho‑stratigraphy is possible when the underground is mapped in greater detail, thus allowing for a better classification of the strata of mixed nature.
Table 2 ‑ Simplified stratigraphy and lithology in the Tronchetto area of Venice, Italy.
| Layer | Mid–layer depth (m) | Layer thickness (m) | Compactable thickness (m) | Lithological description |
| 1 | 28.0 | 56 | 45 | Clay, mud, sand with clayey intercalations, sandy clay, peaty clay |
| 2 | 71.5 | 31 | 31 | Sand, clayey sand, alternating sand and clay |
| 3 | 92.0 | 10 | 10 | Prevalently clay |
| 4 | 102.0 | 10 | 10 | Sand with thin layers of clay |
| 5 | 113.0 | 12 | 6 | Alternate layers of clayey sand and clay |
| 6 | 137.0 | 36 | 36 | Sand, sand with clayey intercalations |
| 7 | 159.0 | 8 | 8 | Prevalently clay |
| 8 | 168.0 | 10 | 10 | Sand, clayey sand |
| 9 | 194.0 | 22 | 22 | Clayey sand, sand intercalated by clay |
| 10 | 210.0 | 10 | 10 | Prevalently clay |
| 11 | 222.5 | 15 | 15 | Prevalently sand |
| 12 | 242.5 | 25 | 25 | Prevalently clay |
| 13 | 267.5 | 25 | 25 | Prevalently sand, light sandstone, thin layers of light gravel |
| 14 | 285.0 | 10 | 8 | Alternate layers of sand and clay |
Table 3 shows the piezometric levels measured in 1905 at various depths. The correlation between the depth of Table 3 and the aquifer levels of Table 2 is far from perfect. This could be due to errors in making the measurements of Table 3, but also likely is due to different geologic characteristics and the locations and depths of wells where the values of Table 3 were taken. In recent time, new data have permitted the compilation of Table 4 in which the piezometric levels of the various aquifers are average values based on a number of boreholes of the same depth.
Table 3 ‑ Piezometric level observed in Venice as of 1905.
| Measurement depth (m) | Piezometric level (m above mean sea level) |
| 56 | 2.95 |
| 91 | 3.80 |
| 112 | 4.55 |
| 135 | 4.90 |
| 155 | 5.60 |
| 170 | 6.25 |
| 198 | 6.70 |
Table 4 ‑ Combined data from several wells in the Venice area.
| Layer | Piezometric level (m above mean sea level) | |
| in 1940 | in 1966 | |
| 2 | 1.5 | |
| 4 | 1.0 | −3.0 |
| 6 | 2.5 | |
| 11 | 2.0 | −6.0 |
| 13 | 4.0 | −4.5 |
An analysis by Lofgren and Klausing (1969) on nonconsolidated soil (like that of the Venice Lagoon) to a depth of 230 m yielded porosity values from 0.35 to 0.55, with values near 0.4 occurring most frequently. The average specific weight of solid grains in the same study varied from 2680 to 2730 kg/m3. We assume an average value for the porosity ϕ of 0.4 and for the specific weight of soil grains, 2700 kg/m3.
More difficult is the choice of average values for compressibility of the sand and clay, due to the wide range of variability of these parameters. Figure 34a provides the behavior of cb versus σz for sand and Figure 34b gives the behavior for clay. Notice that the values of Figure 34a are lab values measured on samples that were allowed to expand laterally while in situ compaction occurs with lateral expansion precluded (oedometric conditions). Hence the values of Figure 34a must be multiplied by the factor:

that is, 0.55, assuming v (Poisson ratio) = 0.25.
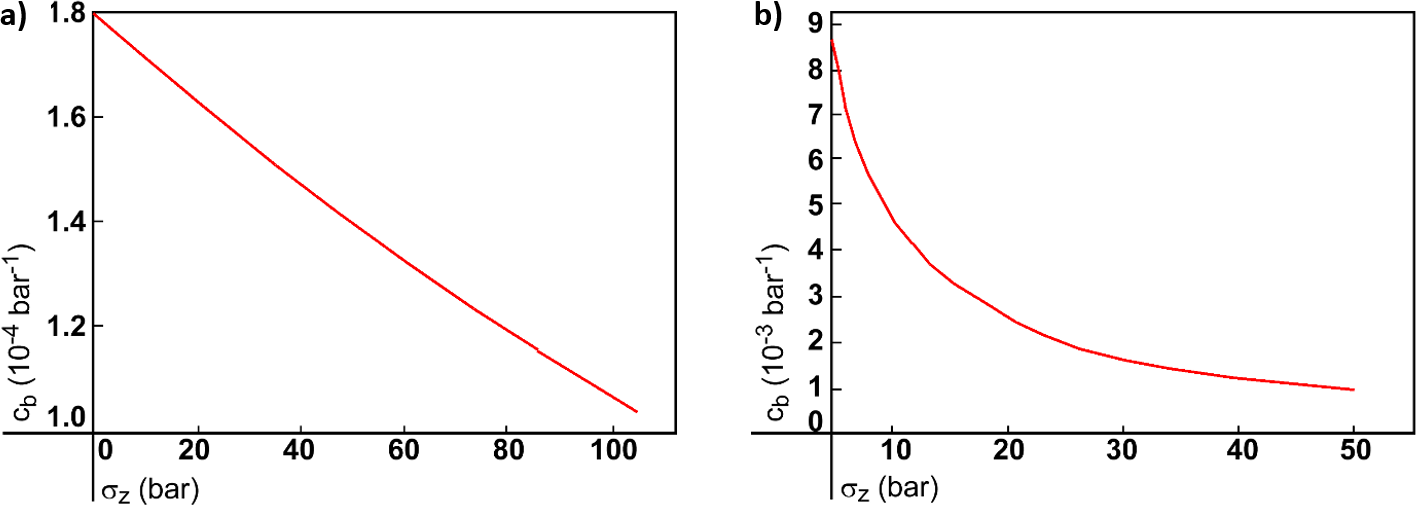
Figure 34 ‑ Stress‑dependent compressibility of a) sand and b) clay in the Venice coastland (modified after Gambolati (1972)).
The subsidence calculation is made for the period 1952‑1969 where subsidence observations are available. Table 5 provides the initial stress σz0 for each depth interval of Table 2 assuming full saturation throughout, and the compressibility derived from either Figure 34a for sand or Figure 34b for clay. Numerical values for the midplane of each stratum were used in the calculation.
Table 5 ‑ Initial stress and compressibility for layers of the Venice lithostratigraphic sequence.
| Layer | σz0 (bar) | cb (10−4 bar−1) |
| 1 | 3.0 | 50.0 |
| 2 | 7.0 | 0.96 |
| 3 | 9.0 | 50.0 |
| 4 | 10.0 | 0.94 |
| 5 | 11.0 | 45.0 |
| 6 | 13.5 | 0.93 |
| 7 | 15.5 | 33.0 |
| 8 | 16.5 | 0.91 |
| 9 | 19.5 | 0.90 |
| 10 | 21.0 | 25.0 |
| 11 | 22.5 | 0.89 |
| 12 | 24.0 | 22.0 |
| 13 | 26.5 | 0.87 |
| 14 | 29.0 | 18.0 |
The data in Tables 3 and 4 are not sufficient to support an unequivocal deduction of the piezometric decline in the aquifers. However, one may note that the two deepest aquifers have had approximately equal decreases in piezometric level between 1940 and 1966, about twice the drop recorded in the layer at 100 m depth. Therefore, it is reasonable to postulate the existence of two distinct families of hydraulically disconnected aquifers separated by the clay layer at 210 m depth (layer 10 in Tables 2 and 5).
We have summarized our analysis and evaluation of the piezometric level data available in the representative data of Table 6. In some cases, the values differ from the observations of Tables 3 and 4, although they retain the order of magnitude involved and individually have only a slight influence on the final calculation of subsidence, which is substantially affected by the difference between the piezometric levels of successive periods. The difference in values used in the practical calculation are summarized in Table 7. Between 1900 and 1944, from 1944 to 1966, and between 1966 and beyond, we assume a linear time dependence of the piezometric level.
Table 6 ‑ Derived data for the decline of the piezometric levels in the Venice aquifer.
| Layer (aquifer only) | Piezometric level (m above mean sea level) | ||
| 1900 | 1944 | 1966 | |
| 2 | 3.0 | 1.5 | −3.0 |
| 4 | 5.0 | 1.5 | −3.0 |
| 6 | 5.0 | 1.5 | −3.0 |
| 8 | 5.0 | 1.5 | −3.0 |
| 11 | 5.0 | 3.0 | −5.0 |
| 13 | 5.0 | 3.0 | −5.0 |
Table 7 ‑ Computation of the subsoil compaction and total land subsidence in the Tronchetto area of Venice.
| Layer | cv (m2/year) | Piezometric level change 1952–1969 (m) | Compaction 1952–1969 (cm) |
| 1 | 3.95 | ||
| 2 | -3.5 | 0.10 | |
| 3 | 0.45 | 1.20 | |
| 4 | -3.5 | 0.03 | |
| 5 | 0.90 | ||
| 6 | -3.5 | 0.10 | |
| 7 | 0.45 | 0.75 | |
| 8 | -3.5 | 0.03 | |
| 9 | 0.07 | ||
| 10 | 0.45 | 0.87 | |
| 11 | -6.4 | 0.08 | |
| 12 | 0.45 | 1.10 | |
| 13 | -6.4 | 0.13 | |
| 14 | 0.28 | ||
| Total subsidence 1952–1969 (cm): | 9.60 | ||
Finally, to make use of these data, we must have a value of the coefficient of consolidation cv of clay. Referring again to the experience by Lofgren and Klausing (1969), we adopt the value cv = 0.45 m2/year found for clay at depth. For the upper layer we ignore the existence of delay, and we extend this assumption to the strata with thin alternations of sand and clay, because of the small thickness of the clay layers.
We have calculated, for each sand and clay stratum, the compaction from 1952 through 1969, with data from Tables 2, 5, and 6. For clay layers 3, 7, 10, and 12 it was necessary to calculate, with the data of Table 7, the compaction that occurred between 1900 and 1952 and between 1900 and 1969. This was done using Figure 17, by distributing the reduction in piezometric level proportionally over the periods 1900‑10, 1910‑20, 1920‑30, 1930‑40, 1940‑44, 1944‑52, 1952‑60, 1960‑69. It was assumed that the piezometric decline over each period occurred instantaneously at the period beginning with the superposition of the effects of all the instantaneous declines. It was also assumed that the effect of the extraction did not propagate below 290 m, the depth of the deepest well in the Venice Lagoon area. The results of our calculations are shown in Table 7. The computed subsidence amounts to 9.6 cm and compares quite satisfactorily with the value of 12 cm measured in Venice over the 1952‑1969 period.