3.3 InSAR
Many scientific papers have been published over the last two decades on the topic of interferometric Synthetic Aperture Radar (SAR)‑based methodologies for measuring displacements in the earth surface, in particular, land movements due to groundwater pumping (for example, Amelung et al., 1999; Hoffmann et al., 2001; Buckley et al., 2003; Hoffmann et al., 2003; Galloway and Hoffmann, 2007; Bell et al., 2008; Higgins et al., 2014; Tosi et al., 2016; Da Lio et al., 2018). The most well‑known and widely used SAR processing‑chains among a continuously increasing variety of algorithms include: Differential SAR Interferometry ‑ DInSAR (Gabriel et al., 1989), Permanent Scatterer InSAR ‑ PSInSAR (Ferretti et al., 2001), Small Baseline Subset ‑ SBAS (Berardino et al., 2002), Interferometric Point Target Analysis ‑ IPTA (Wegmuller et al., 2004), and ‘‘Squeezed’’ SAR ‑ SqueeSAR (Ferretti et al., 2011).
SAR‑based techniques exploit the phase difference of the radar signals between or among a number (at least two) of satellite acquisitions over the same area. The phase difference is strictly related to the earth surface displacement occurring between the acquisitions once the surface topography contribution is removed and the atmospheric disturbance mitigated. SAR‑based methodologies allow for the detection and measurement of sub‑centimeter‑scale ground movement with high spatial detail and high measurement resolution. Several SAR‑borne satellites have been in operation from 1991 to the present (ERS‑1/2; ENVISAT; JERS‑1; Radarsat‑1/2, ALOS, TerraSAR‑X, Cosmo‑SkyMed) and SENTINEL‑1 has been in operation since mid‑2014, thus a large satellite SAR data archive exists over many areas. Figure 21 shows two significant examples of SAR‑derived land subsidence.
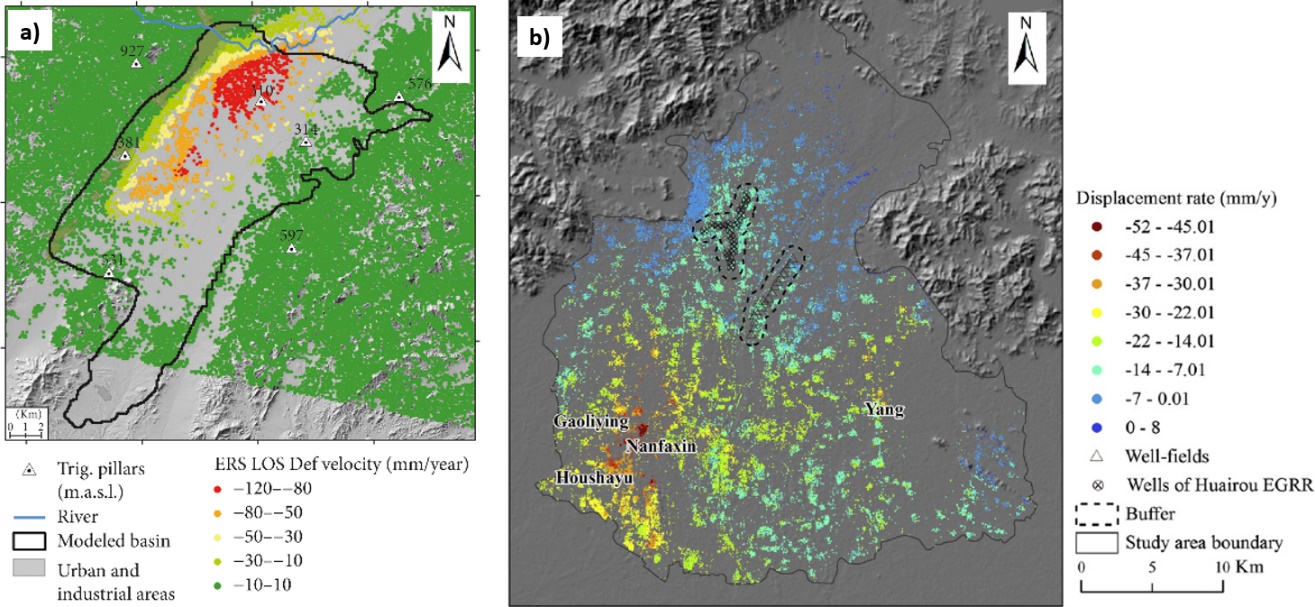
Figure 21 ‑ a) Alto Guadalentín Aquifer (SE Spain): LOS deformation velocities from ERS data (C‑band, 1992–2000) (modified after Ezquerro et al., 2017). b) Northern Beijing plain, China: average displacement rate detected by IPTA from June 2003 to January 2010. Negative values mean land subsidence, positive values mean uplift (modified after Zhu et al., 2015).
As in the case of leveling, SAR‑based data are differential measurements, that is, displacements relative to a reference point. Therefore, the movement of the reference point has to be known, for example, from previous leveling or permanent GPS stations, in order to calibrate the SAR results and obtain “absolute” displacements. SAR‑based measurements are 1‑D measurements related to the projection along the satellite Line‑Of‑Sight (LOS) of the 3‑D displacement vector affecting the radar target. Given that the radar viewing angle is less than 45° from the vertical, the SAR outcome is most sensitive to vertical motion. However, the combination of the Earth’s rotation and satellite motion makes it possible for any area of interest to be illuminated by the satellite radar sensor along two different acquisition geometries: one having the satellite flying from south to north, known as “ascending mode” and the other from north to south called “descending mode” as portrayed in Figure 22.

Figure 22 ‑ The satellite SAR imaging geometry along the ascending and descending orbits and the projection relation between the LOS displacements and the 3‑D motion components. The a) combination of movement components along the ascending (dasce) and descending (ddesce) LOS directions allows for quantification of actual displacements (d) and, consequently; b) displacement components along both vertical (dvertical) and west‑east (deast) directions.
Whenever two data sets of SAR images are available, acquired over the same area and during the same time frame along ascending and descending orbits, the SAR results can be used successfully to estimate two components of the local displacement, that is, the vertical (dvertical) and the west‑east (deast) components, thus significantly improving our understanding of the event under study as illustrated for the Phoenix, Arizona, USA area in Figure 23. The following system of equations can be used to make the determinations (Pepe and Calò, 2017).

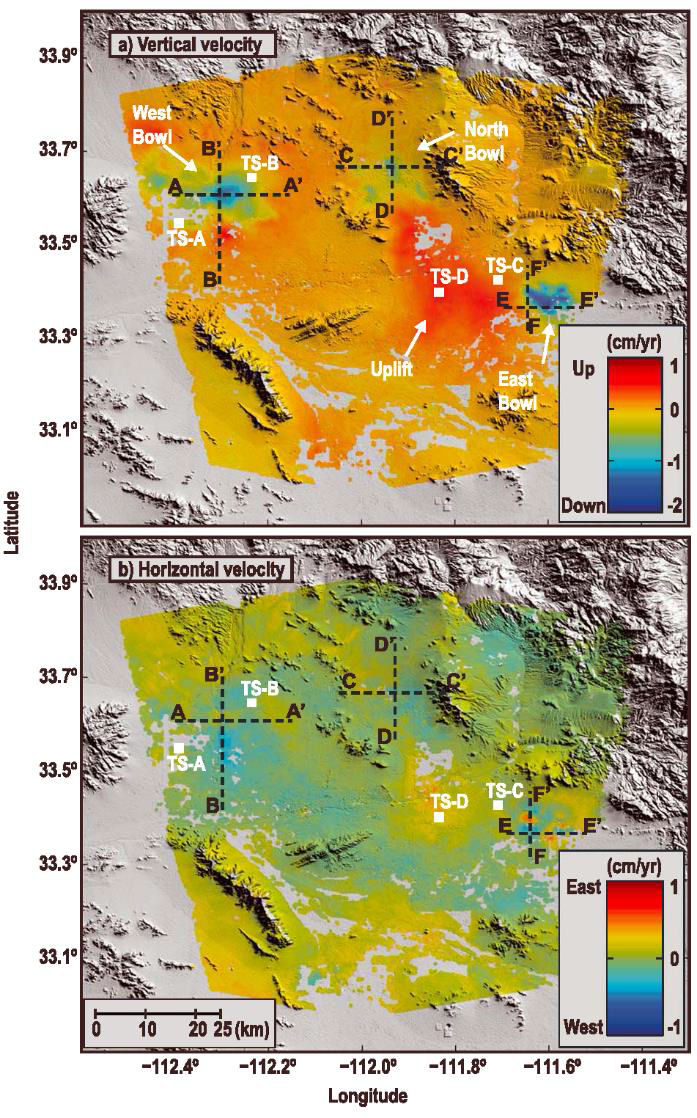
Figure 23 – In the Phoenix, Arizona, USA metropolitan area: a) vertical and b) horizontal velocity maps from ENVISAT ascending and descending combined data sets (modified from Miller and Shirzaei, 2015).
SAR processing‑chains can provide millions of data points over a large region (1×10⁴ to 1×10⁵ points per km2) and are often less expensive than sparse point measurements from “traditional” labor‑intensive spirit‑leveling and costly C‑GPS stations. Moreover, SAR results have shown that land displacements due to groundwater withdrawal and injection are characterized by a spatial variability almost impossible to detect by other surveying techniques. For these reasons, leveling and GPS have been used less and less over recent years to measure land subsidence. However, we emphasize that they remain of paramount importance in calibrating the SAR outcome as described above, and are essential in providing measurements over natural terrain, densely vegetated zones, or farmlands where the SAR signal loses coherence and the interferometric algorithm cannot be applied.