1.3 Occurrence
Land subsidence is perhaps the most widespread and threatening geomechanical consequence of groundwater pumping. When groundwater withdrawals occur in densely populated and highly developed areas underlain by unconsolidated geological basins of alluvial, lacustrine or shallow marine origin, formed typically, although not exclusively, in the Quaternary period land subsidence is likely. Areas located close to the sea or a lagoon or delta are often impacted by subsidence. Quite often, especially at the onset of the occurrence, land settlement goes unnoticed, only to be discovered later on, when severe damage has already taken place. At this stage, undertaking effective remedial measures to mitigate the associated environmental and socio‑economic impact may prove tremendously expensive. However, in recent times our awareness concerning the damage threatened by potential anthropogenic land subsidence has significantly grown at both the political and the general public level, thus contributing to lower the alarm threshold. As a major result, the most recent plans for subsurface resource development usually include a study of the related environmental impact presenting, wherever appropriate, numerical predictions of the expected land settlement above (and close to) the exploited system.
Figure 9 shows the areas of major anthropogenic land subsidence due to groundwater extraction worldwide. Table 1 gives the most significant records of the occurrences depicted in Figure 9. The maximum recorded land settlement of all time amounts to more than 14 m and was due to geothermal water production at Wairakei geothermal field, New Zealand (Allis et al., 2009) as shown in Figure 10a. However, settlement depths approaching 10 m are not unusual as in the San Joaquin Valley, California, USA (Galloway and Riley, 1999) and as shown in Figure 10 for Mexico City, Mexico (Cabral‑Cano et al., 2008; Otiz‑Zamora and Ortega‑Guerrero, 2010).
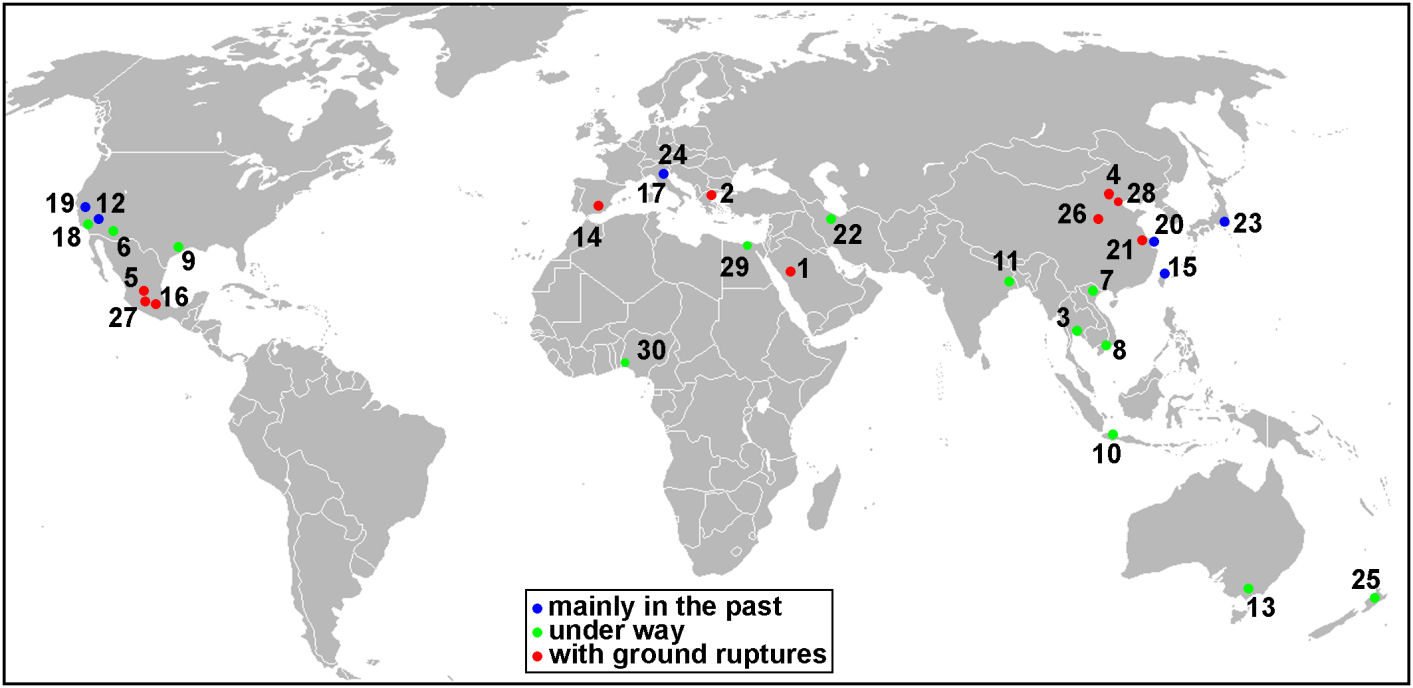
Figure 9 ‑ Major worldwide areas of anthropogenic land subsidence due to groundwater withdrawal. Different symbols are used to distinguish cases of subsidence (i) occurring mainly in the past, (ii) still under way, and (iii) associated with ground rupture. 1: Wadi Al‑Yutamah, Saudi Arabia; 2: Anthemountas Basin, Greece; 3: Bangkok, Thailand; 4: Beijing, P.R. China; 5: Celaya, Mexico; 6: Eloy Basin, Arizona, USA; 7: Hanoi, Vietnam; 8: Ho Chi Minh, Vietnam; 9: Houston, Texas, USA; 10: Jakarta, Indonesia; 11: Kolkata, India; 12: Las Vegas, Nevada, USA; 13: Latrobe Valley, Australia; 14: Lorca, Spain; 15: Taipei, Taiwan; 16: Mexico City, Mexico; 17: Ravenna, Italy; 18: San Joaquin Valley, California, USA; 19: Santa Clara Valley, California, USA; 20: Shanghai, P.R. China; 21: Su‑Xi‑Chang area, P.R. China; 22: Tehran, Iran; 23: Tokyo, Japan; 24: Venice, Italy; 25: Wairakei, New Zealand; 26: Xian, P.R. China; 27: Zamora de Hidalgo, Mexico City; 28: Tianjin, P.R. China; 29: Nile River delta, Egypt; 30: Lagos, Nigeria.

Figure 10 ‑ a) Total subsidence at the Wairakei geothermal field over the 1953–2005 period. Contour line interval: 1 m; maximum subsidence contour line: 14 m (after Allis et al., 2009). b) The locations of the monitoring points. c) Multitechnique composite plot of the subsidence in the Mexico City downtown area since 1895. Pre‑1985 leveling data were collected at selected city landmarks, whereas 1985–2002 data were derived from leveling of a modern benchmark network (after Cabral‑Cano et al., 2008).
The depth of fluid abstraction wells may range from those tapping very shallow water table aquifers quite close to the ground surface, to those tapping very deep (4000‑5000 m) gas/oil reservoirs. The overall extent of the sinking area can be large, totaling as much as 13,500 km2 in the San Joaquin Valley (Poland and Lofgren, 1984) and 12,000 km2 in the Houston‑Galveston area of Texas (Gabrysch and Neighbor, 2000. China is perhaps the country with the largest cumulative area of subsidence (about 80,000 km2) subsurface water overdraft has occurred. Figure 9 also shows the major sinking cities in China (Xue et al., 2005). For an initial review of human‑induced land subsidence through illustrative case histories worldwide and more recently from across the United States, the reader may consult Poland (1984) and Galloway et al. (1999), respectively.
Table 1 ‑ Selected areas of major land subsidence due to groundwater withdrawal worldwide. The time of occurrence is provided between parentheses. Rates represent the local maximum measured rate for the specified period. Negative values indicate uplift.
| # | Location | Maximum subsidence (m) | Maximum rate (cm/yr) | Depth of pumping (m) | Area of subsidence (m2) | Principal references |
| 1 | Wadi Al-Yutamah | 0.3 (1993-1996) | – | 0-150 | 150 | Banker and Al-Harthia [1999] |
| 2 | Anthemountas Basin | – | 3.5 (1995-2001) | 30-150 | 40 | Raspini et al. [1933] |
| 3 | Bangkok | 2.1 (1933-2002) | 2 (2005-2010) | 30-300 | 700 | Phien-wej et al. [2006]; Aobpaet et al. [1999] |
| 4 | Beijing | 1.1 (1955-2007) | 5 (2003-2010) | 20-400 | 4200 | Zhang et al. [2014] Zhu et al. [2014] |
| 5 | Celaya | 3.1 (1985-2008) | 9 (2007-2011) | 50-200 | 50 | Huizar-´Alvarez et al. [2011]; Chaussard et al. [2014] |
| 6 | Eloy Basin | 3.0 (1948-1977) | 4 (2010-2014) | 100-760 | 1000 | Holzer et al. [1979]; Conway [2014] |
| 7 | Hanoi | 0.5 (1988-2003) | 7 (2007-2011) | 0 – 80 | 35 | Thu and Fredlund [2000]; Dang et al. [2014] |
| 8 | Ho Chi Minh | 0.4 (1996-2005) | 4 (2006-2010) | 50-240 | 250 | Erban et al. [2014] |
| 9 | Houston | 3 (1915-2000) | 2.5 (2005-2012) | 60-900 | 12000 | Gabrysch and Neighbors [2000]; Yu et al. [2014] |
| 10 | Jakarta | 4.1 (1974-2010) | 26 (2007-2011) | 40-240 | 660 | Ng et al. [2012] |
| 11 | Kolkata | 1.1 (1956-2000) | 4 (2001-2005) | 50-160 | 150 | Shau and Sikdar [2011] |
| 12 | Las Vegas | 2 (1935-2000) | 2.5 (1997-1999) | 200-300 | 250 | Amelung et al. [1999]; Hoffmann et al. [2001] |
| 13 | Latrobe Valley | 1.3 (1960-1977) | 1.5 (2006-2011) | 0-150 | 400 | Gloe [1984] |
| 14 | Lorca | 2.2 (1992-2012) | 16 (1992-2011) | 50-300 | 140 | Gonzalez et al. [2012] |
| 15 | Taipei | 2 (1955-1991) | -0.7 (1989-2003) | 50-250 | 200 | Chen et al. [2007] |
| 16 | Mexico City | 13 (1960 to present) | 30 (2007-2011) | 0-350 | 250 | Ortiz-Zamora and Ortega-Guerrero [2010]; Chaussard et al. [2014] |
| 17 | Ravenna | 1.4 (1897-2002) | 0.2 (1998-2002) | 80-450 | 400 | Teatini et al. [2006] |
| 18 | San Joaquin Valley | 10 (1930 to present) | 30 (2007-2011) | 60-600 | 13500 | Galloway and Riley [1999]; Borchers and Carpenter [2014] |
| 19 | Santa Clara Valley | 4.3 (1910-1995) | -0.5 (1992-2000) | 50-280 | 500 | Schmidt and Burgmann [2003]; Borchers and Carpenter [2014] |
| 20 | Shanghai | 2.6 (1958-2002) | 1.5 (2006-2011) | 10-330 | 5000 | Wu et al. [2010]; Dong et al. [2014] |
| 21 | Su-Xi-Chang area | 1.1 (1960-1995) | 3 (2003-2008) | 20-200 | 4000 | Shi et al. [2007]; Yu et al. [2009] |
| 22 | Tehran | 3.0 (1989-2004) | 15 (2004-2005) | 20-100 | 500 | Mahmoudpour et al. [2013] |
| 23 | Tokyo | 4.3 (1900-1975) | -0.3 (1991-2005) | 0-400 | 3400 | Sreng et al. [2011] |
| 24 | Venice | 0.12 (1952-1973) | 0.1 (2008-2011) | 70-350 | 150 | Gambolati et al. [1974]; Teatini et al. [2012] |
| 25 | Wairakei | 14.5 (1950 to present) | 9 (2000-2007) | 250-800 | 25 | Allis et al. [2009] |
| 26 | Xian | 2.3 (1959-1995) | 11 (2005-2012) | 50-370 | 240 | Zhao et al. [2008]; Qu et al. [2014] |
| 27 | Zamora de Hidalgo | – | 18 (2007-2011) | 0-300 | 15 | Chaussard et al. [2014] |
| 28 | Tianjin | 3.2 (1959-2007) | 11 (1975-1985) | 0-550 | 8000 | Yi et al. [2011] |
| 29 | Nile River delta | – | 1 (2004-2010) | 20-200 | 4800 | Gebremichael et al. [2018] |
| 30 | Lagos | – | 0.6 (2011-2018) | 50-200 | 350 | Cian et al. [2019] |