Box 2 Visualization of Relationship between Effective Stress and Void Ratio
To visualize the relationship between compaction and void ratio presented in Figure 2, which is repeated here for the readers convenience, it is useful to view abstract version of Figure 2. In the abstract version (Figure Box 2‑1) in which all solids are grouped with no pore space, and all pore space occupies the remainder of the volume, with example values are assigned, as illustrated in Figure Box 2‑1. The total compaction η of a layer as illustrated in Figure 2, with initial thickness s0 and initial void ratio e0 is completely due to reduced pore space as reflected by Equation 4 (repeated here for the readers convenience).
 |
(repeat of Equation 4) |

Repeat of Figure 2 for the reader’s convenience ‑ Soil compaction η with a reduction of the porous space (grains are incompressible for all practical purposes).
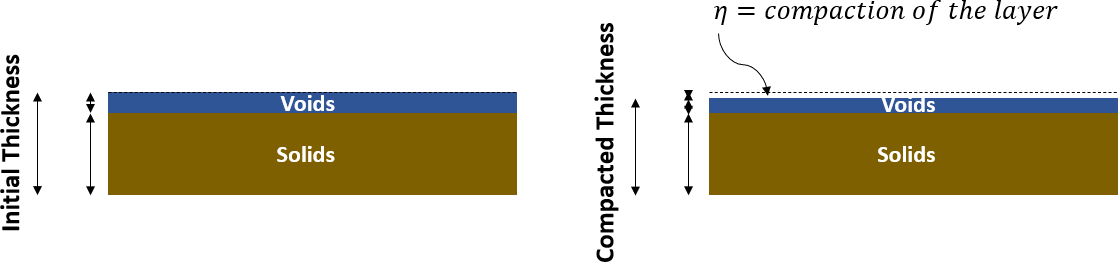
Figure Box 2‑1 ‑ Abstract representation of the fine‑grained layer of Figure 2 in which all solids are grouped with no pore space, all pore space occupies the remainder of the volume.
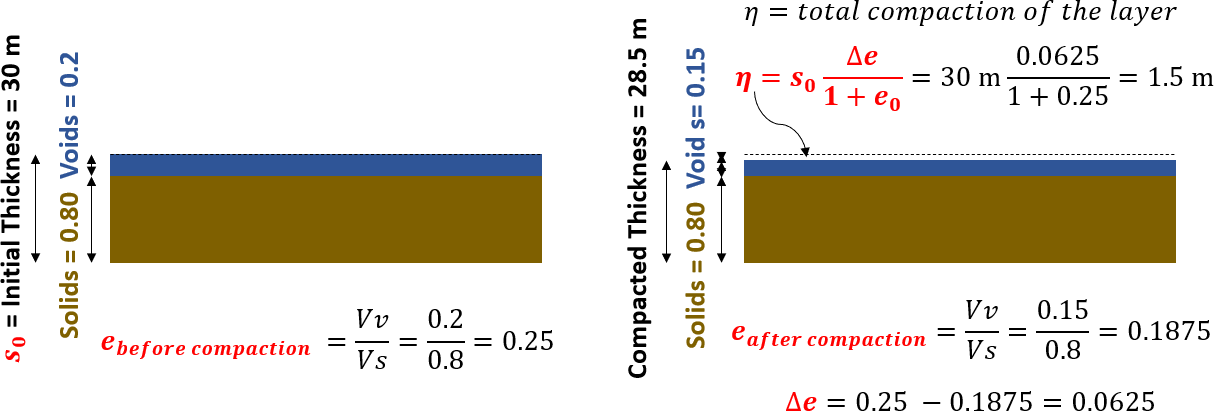
Figure Box 2‑2 ‑ Soil compaction η illustrated using the abstract example of the fine‑grained material shown in Figure Box 2‑1 with example values assigned to the pertinent parameters.
Calculation of the change in effective stress for a decline in the piezometric level from A to B at a point within an unconfined aquifer as shown in Figure 13, is illustrated in Figure Box 2‑3 and Figure Box 2‑4.
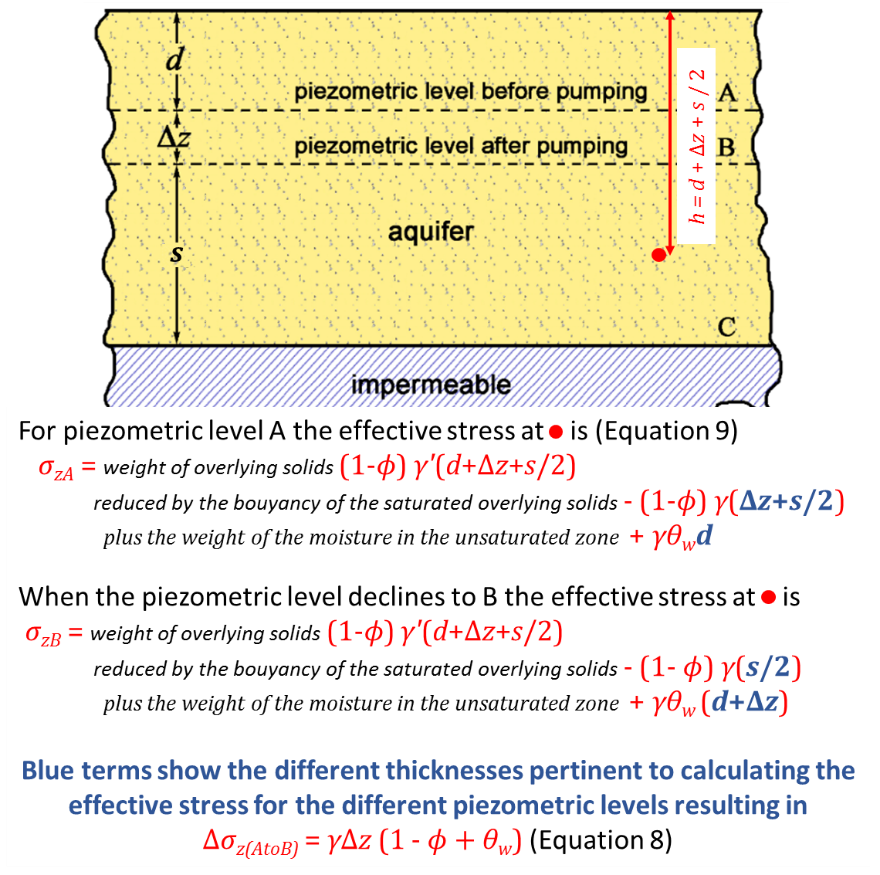
Figure Box 2‑3 ‑ Presentation of Equations 8 and 9 in words.
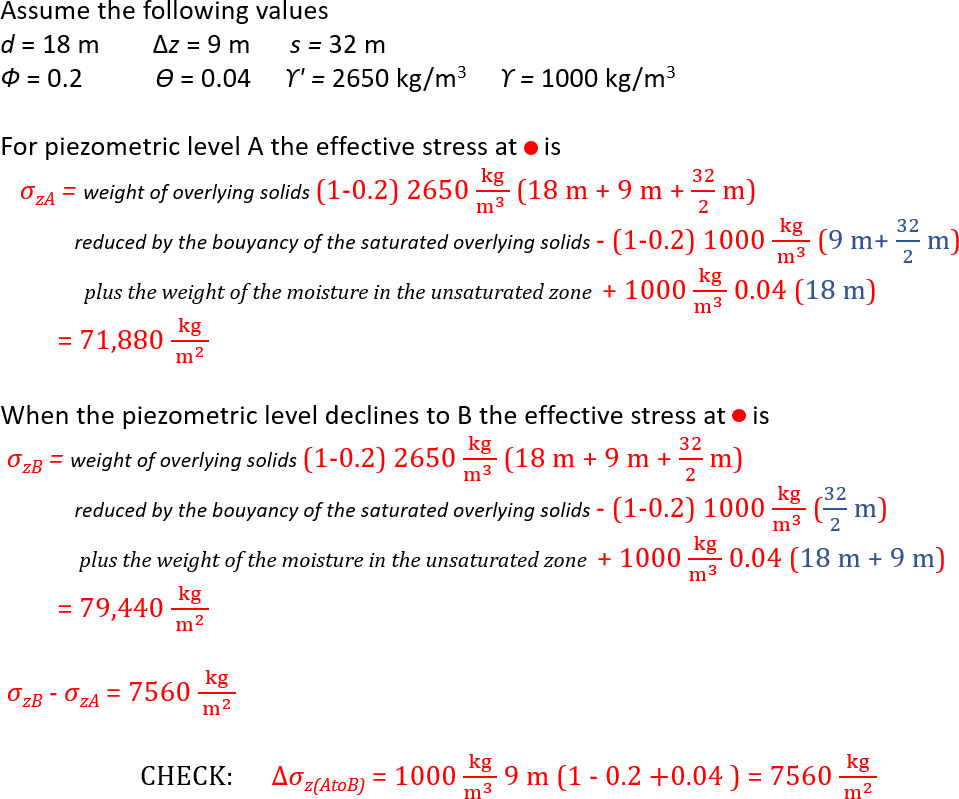
Figure Box 2‑4 ‑ Worked example of calculating effective stress.