6.4 Fault Zones
The schematic diagram in Figure 18 represents the major components of a fault zone: a fault core with one or many slip surfaces, and damage zones commonly flanking the fault core on both sides. The fault core contains deformed rock accumulated during the fault growth. Both fault core and damage zones evolve during the history of faulting through various deformation mechanisms (Aydin and Berryman, 2010), and therefore show a wide range of variations. A short introduction to the case study of fault zones in Aztec Sandstone at the Valley of Fire State Park, Nevada, USA, is presented in this section.
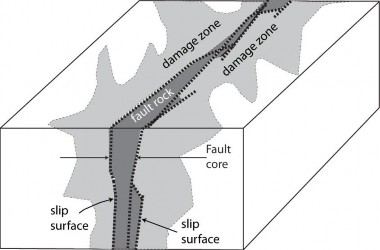
Figure 18 – Idealized diagram showing fault zone elements, including the fault core, which includes fault rock and several slip surfaces, and the surrounding damage zone. From Aydin and Berryman (2010).
Figure 19 shows a photograph of a fault zone in the Aztec Sandstone with its core and damage zone identified. This fault zone has a 14 m left-lateral slip based on matching dune units on two sides of the fault.
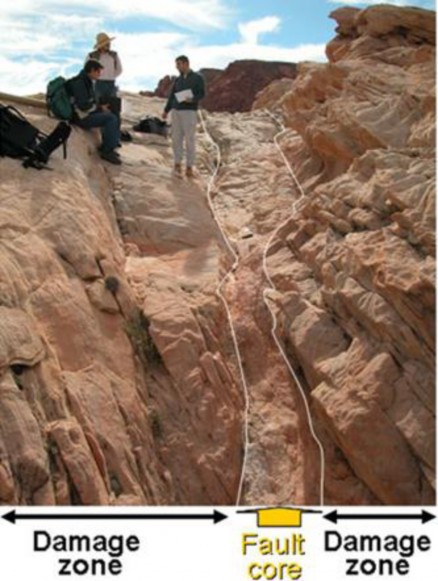
Figure 19 – Photograph showing a portion of a fault zone with a 14 m left-lateral slip in the Aztec Sandstone at Valley of Fire State Park, Nevada, USA. The fault core and associated damage zone on both sides are visible. From left to right, Ghislain de Joussineau, Joseph Gonzales and Ramil Ahmadov provide a reference for scale. From Aydin and Zhong (2017).
Figure 20 is a close-up of a part of this zone, not far from the top side of the area covered by the larger view in Figure 19. Arrows mark several slip surfaces in the detailed photograph. It is possible to identify reddish infills along these surfaces. These are called “slip bands” (Ahmadov, 2006; Ahmadov et al., 2007). Slip bands along the core marked by arrows are continuous within the photos, but other bands that are discontinuous are generally diagonal to the overall direction of the core. Many of these are earlier slip bands that rotated during the evolution of the fault zone, and eventually became inactive during fault growth. Some properties of slip bands including their composition and permeability are reported in Box 2.

Figure 20 – Close-up photograph of the fault in Figure 19. Relatively continuous slip surfaces with reddish-stained slip bands in the fault core are marked with arrows below the photograph. Modified from Ahmadov and others (2007).
The upscaled (or effective) permeability of a small-scale fault zone with 14 m of left-lateral slip is plotted in Figure 21. The overall computed permeability normal to the fault zone (k1 or kx) is 8 mD and 44 mD for each 5 × 5 m block, respectively, whereas the overall computed permeability parallel to the fault zone (k2 or ky) is 1,320 mD and 1,480 mD for each block, respectively. The latter values are smaller and greater, respectively than the average host rock permeability of about 200 mD (Jourde et al., 2002). This is due to low permeability across the crushed fault core and high permeability along the damage zone. Additional examples of fluid flow modeling in fractured rocks are provided by Manzocchi and others (1999), Flodin and others (2004), Karimi-Fard and others (2004) and Spence and others (2014).

Figure 21 – Upscaled (i.e., effective permeability, k) of two adjacent 5 × 5 blocks along the fault shown in Figure 19 and Figure 20. The bird’s-eye view of the fault map shown here is from Myers (1997) and the upscaling model is from Jourde and others (2002).