5.3 Aquifers and Aquitards
The flow and associated hydraulic gradient scenarios shown in the previous figures are also present in aquifers separated by an aquitard. As shown in Figure 26, the horizontal gradient in the unconfined aquifer and confined aquifer are defined by the water table and potentiometric surface, respectively. In Figure 26, head decreases towards the right in both aquifers. Accordingly, groundwater flows towards the right. However, there is a difference in hydraulic head above and below the aquitard, as shown by the labeled head values on the cross section. These values are based on the water table and potentiometric surface. Figure 26a illustrates the water table and potentiometric surface and shows the hydraulic heads at the two ports in the graph on the right. Figure 26b shows the same scenario using a multiport well with many sample points.
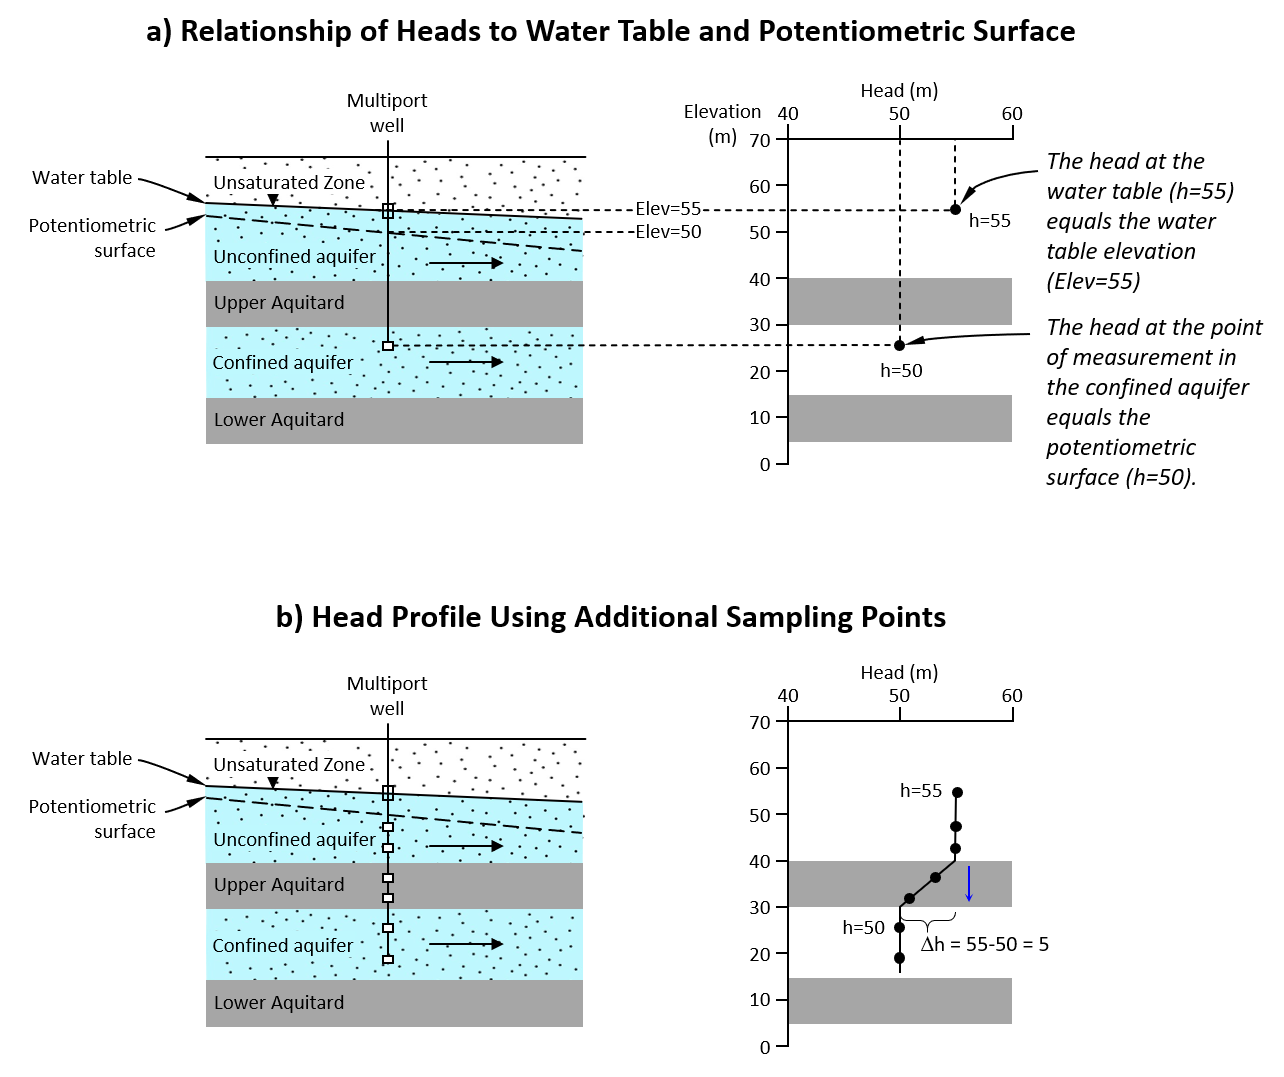
Figure 26 – Example of horizontal flow and associated vertical head profile in: a) an unconfined and b) a confined aquifer, and the associated vertical gradient in an aquitard (Cohen and Cherry, 2020).
The chart on the right side of Figure 26b shows a portion of the corresponding vertical hydraulic gradient profile. There is a distinct change in hydraulic head across the aquitard, which is indicative of a zone of lower hydraulic conductivity. The vertical hydraulic head gradient indicates that, although most of the flow in the unconfined and confined aquifers is horizontal, there is a fraction (albeit relatively small) that flows downward through the aquitard (from higher head to lower head). As mentioned earlier, it is important to note that the vertical gradient does not necessarily mean that the flow through the aquitard is vertical. Rather, it indicates that there is a vertical component of flow.
If the presence of a lower-K interval (e.g., the upper aquitard) was not known, the hydraulic heads shown in Figure 26a could be interpreted as an indication of downward flow throughout the entire saturated zone, because the head is higher (h=55 m) in the shallower zone than in the deeper zone (h=50 m). This exemplifies the need to account for the known or potential geologic features and properties of the subsurface when interpreting head data.
Figure 27 shows that the direction of flow in the aquitard is dependent on the relative elevations of the water table and potentiometric surface.

Figure 27 – Head profile across aquitards resulting in: a) downward and b) upward flow (Cohen and Cherry, 2020).
As noted previously, an aquitard is a semi-pervious formation that restricts flow between the overlying and/or underlying aquifers. It may be composed of very low hydraulic conductivity soil or rock that restricts nearly all groundwater flow between the aquifers. In the vicinity of a recharge or discharge area, the groundwater in both unconfined and confined aquifers can have a significant vertical flow component even in the presence of an aquitard.
In some cases, the hydraulic conductivity of the aquitard is less restrictive, and some groundwater may flow between the overlying and underlying aquifers. Such a formation may be referred to as a leaky aquitard. In either case, groundwater is present and fully saturates the aquitard, and therefore some hydraulic connection between the aquifers exists. Accordingly, there is a hydraulic gradient in the aquitard, as shown in Figure 28.
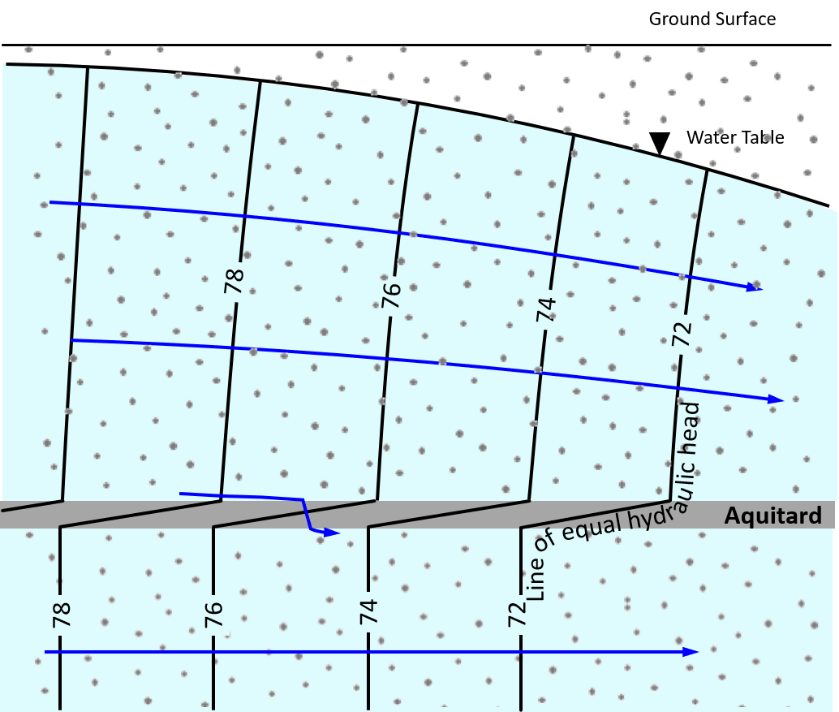
Figure 28 – Potentiometric contour lines in an unconfined and confined aquifer separated by an aquitard (Cohen and Cherry, 2020).
Example Problem 10
Based on the water level data shown, which schematic below best represents the equipotential lines and flow direction?


Click here for solution to Example Problem 10
Example Problem 11
a) Draw potentiometric contours in the lower sand unit at 1 m intervals.
b) Draw the potentiometric surface.
c) What is the direction of groundwater flow through the upper clay unit?
d) Sketch the expected vertical hydraulic head profile in the vicinity of Well 2.

Click here for solution to Example Problem 11
Example Problem 12
a) Draw potentiometric contours in the lower sand unit at 1 m intervals.
b) Draw the potentiometric surface.
c) What is the direction of groundwater flow through the upper clay unit?
d) Sketch the expected vertical hydraulic head profile in the vicinity of well 2.

Click here for solution to Example Problem 12