Problem 10 Solution
Question: Based on the water level data shown, which schematic below best represents the equipotential lines and flow direction?

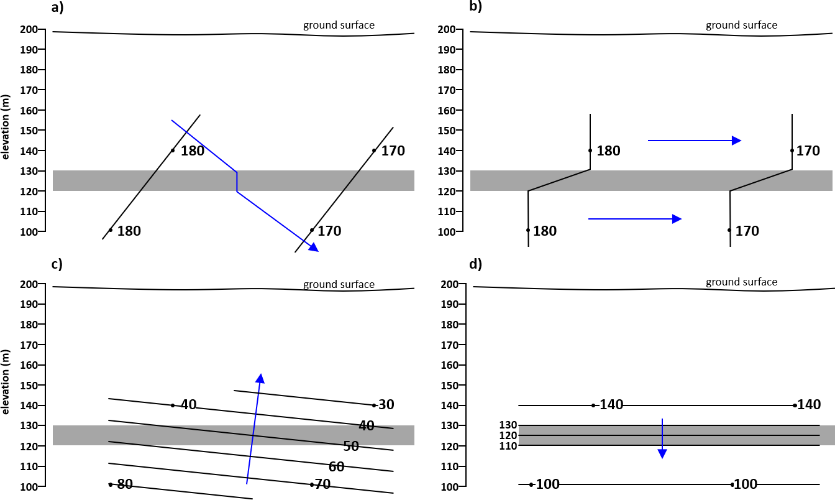
Solution: The correct answer is choice “b”: The head at each screened interval is equal to the elevation of the water level in each well. Based on the head data in the sand zones, hydraulic head decreases toward the right, and vertical flow will be restricted due to the aquitard. Accordingly, flow in the sand zones is mainly horizontal, and the potentiometric contours are nearly vertical because flow is orthogonal to potentiometric contours in isotropic media.
Choice “a” is NOT the correct answer. The head value plotted at each point is correct because it is the elevation of the water in the well. However, this cannot be the correct answer, because the equipotential line does not have an inflection at the top and bottom of the low-K interval (see Figure 28).
Choice “c” CANNOT be the correct answer, because the head values plotted at the points of measurement do not represent hydraulic head. Instead, they represent the height of the water column in each well.
Choice “d” CANNOT be the correct answer, because the values plotted at the points of measurement do not represent hydraulic head; instead, they are the elevations of the points of measurement.