3.3 Quantifying Groundwater Velocities in Confined Aquifers
While groundwater ages in unconfined aquifers can be used to estimate vertical flow velocities and recharge rates, groundwater ages in confined aquifers enable estimation of horizontal groundwater flow velocities. Figure 22 shows the distribution of travel times in a simple confined aquifer of constant thickness. In the confined part of the aquifer, flow lines are horizontal, and groundwater age increases downgradient. The horizontal groundwater velocity (dx/dt) is the inverse of the horizontal age gradient (dt/dx). In practice, the horizontal groundwater velocity (vh) is usually estimated as shown in Equation 12.
 |
(12) |
In Equation 12, t1 and t2 are groundwater ages at two points in the confined part of the aquifer and (x2–x1) is the distance between these points, measured in the direction of flow. It is apparent from Figure 22 that groundwater ages in the confined part of the aquifer also show an increase in age with depth. This vertical age gradient is created within the unconfined part of the aquifer and preserved as the water flows downgradient in the confined part of the aquifer. In many cases, though, the vertical age stratification within the confined part of the aquifer is much less than the horizontal increase in age. Thus, groundwater samples collected from confined aquifers often show an increase in age with distance downgradient, irrespective of the sampling depth.

One of earliest studies that used radioactive 14C as a groundwater dating tool was an investigation into the rate of groundwater flow in the Carrizo-Wilcox aquifer (Figure 23) in south-central Texas (Pearson and White, 1967). The Carrizo-Wilcox aquifer is a confined aquifer that outcrops roughly 200 – 300 km inland from the coast of the Gulf of Mexico, and dips to the southeast (towards the coast) at an angle of 1 to 2 degrees. In northern Atascosa County, the aquifer outcrops on rolling hills as a band that is only 15 to 20 km wide. The thickness of the aquifer is approximately 200 m in the outcrop area but increases towards the southeast.
Water samples were collected for 14C and δ 13C analysis on dissolved carbonate. pH and alkalinity were also measured and used to calculate the total carbonate content and degree of saturation with respect to calcite. 14C values ranged from 77 pmC (percent modern Carbon; Table 1) in the outcrop area to background values (< 0.7 pmC) in the most downgradient samples. Total carbonate content was lowest (2.6 to 2.8 equivalents per million; epm) and δ 13C was most negative (-18.9 to -17.9 ‰) close to the outcrop area, with most downgradient samples having carbonate contents above 5 epm and δ 13C values between -8 and -12 ‰.
Comparison of total carbonate and δ 13C values indicated that most samples could be explained by dilution of 14C by dissolution of geologic layers of marine carbonate formations. However, some samples had high total carbonate concentrations, but did not have correspondingly enriched δ 13C values, indicating that some other process (perhaps dissolution of plant or petroleum-derived carbonate within aquifer materials) was affecting the carbonate chemistry. Therefore, the 14C values were corrected based on the ratio of the measured carbonate concentration to an assumed initial value. After correcting for dilution with geologic carbonate, 14C ages of groundwater increase from less than a few hundred years in the outcrop area to more than 20,000 years at distances greater than 40 km from the outcrop area (Figure 24). The mean groundwater velocity is therefore calculated to be approximately 2 m/y and is in good agreement with hydraulic calculations based on measured hydraulic heads, porosities and hydraulic conductivities.


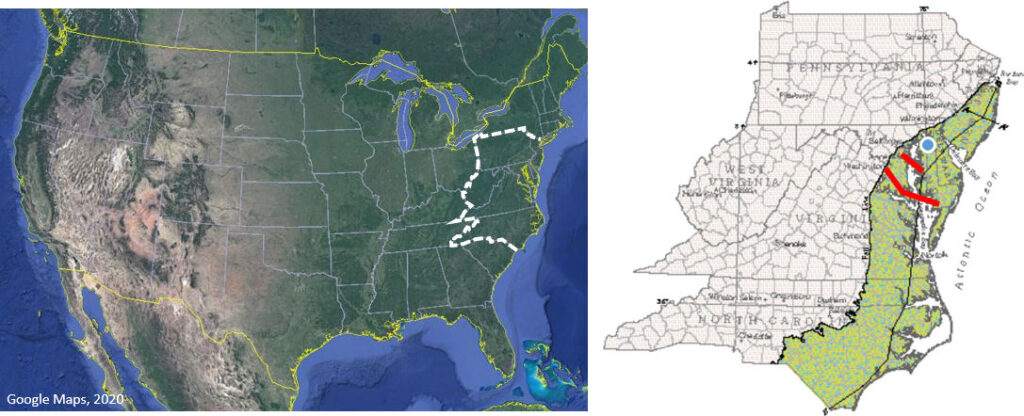
The value of combining different groundwater age tracers to cover the range of ages in large flow systems is illustrated in a study of the confined aquifers of the Atlantic Coastal Plain, Maryland, USA (Plummer et al., 2012). The Atlantic Coastal Plain (Figure 25) consists of a series of wedge-shaped unconsolidated sedimentary deposits that thicken in the direction of groundwater flow. Pumping has greatly changed the flow systems in these aquifers, and so wells were selected along two transects in the Upper Patapsco aquifer that were believed to follow pre-development flow lines. Samples were analyzed for 14C, 36Cl and He, as well as several other environmental tracers.
14C concentrations were measurable only within the first 40 km of the flow system and decreased from 109 pmC near the outcrop area to below detection limit further downgradient (Figure 26). The piezometers with highest concentrations of 14C also contained measurable 3H and CFCs, confirming that the water was very young. The 36Cl/Cl ratio also decreased downgradient, but measurable concentrations were observed for at least 80 km, due to the longer half-life of this tracer. 36Cl ages in this part of the aquifer increased from 23,000 years to 328,000 years on the northern flow path and from 185,000 to 503,000 years on the southern flow path. The most downgradient sample (at 120 km) was close to background and appears to have an age of more than 2 million years. Helium concentrations increased from close to atmospheric values (negligible subsurface production) to more than 8 × 10⁻⁶ cm3 STP/g furthest downgradient. The rate of increase in helium concentration with distance is consistent with the ages obtained from 14C and 36Cl data, within the range of uncertainties of the He production rate.
Ages within the aquifer increase in a non-linear fashion, with flow rate significantly decreasing downgradient. This is consistent with an increase in aquifer thickness with distance in the wedge-shaped aquifer, and with a decreasing volume of flow as water leaks out through confining layers into overlying and underlying aquifers. The average groundwater velocity is estimated to be approximately 1 m/y in the upgradient parts of the aquifer (at about 10 km) and decreases to 0.13 m/y and 0.04 m/y at 40 km and 80 km downgradient, respectively.
