3.2 Quantifying Rates of Groundwater Recharge
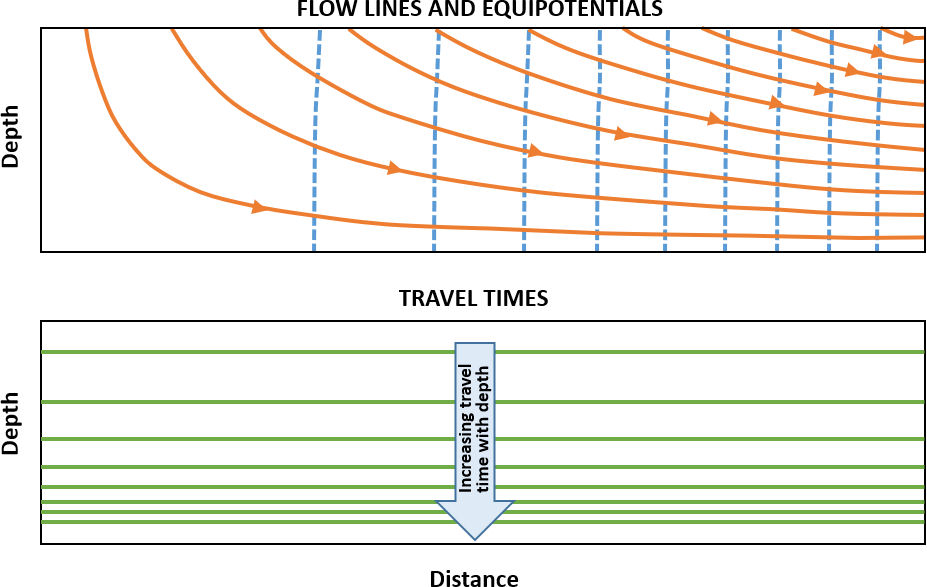
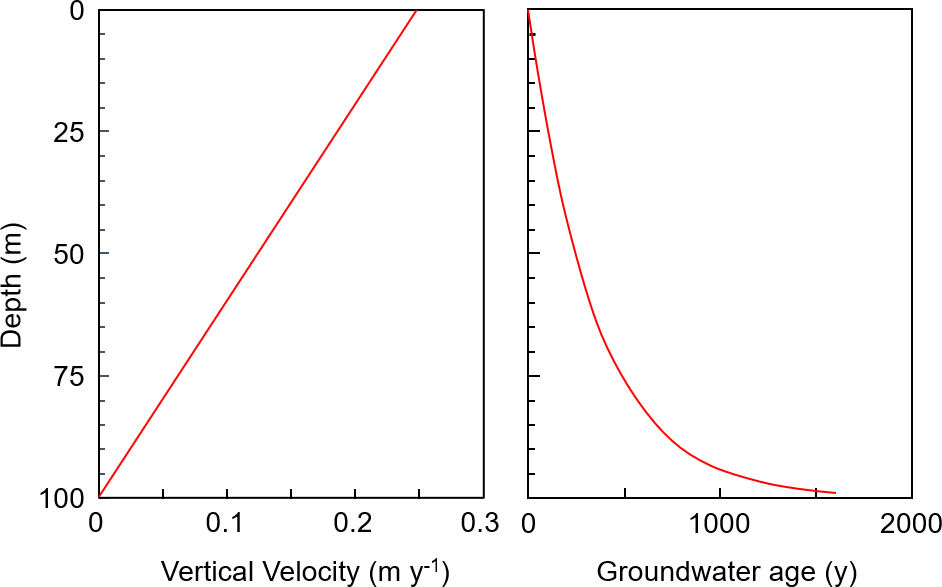
In an unconfined aquifer, groundwater age generally increases with depth. If the recharge rate is high, then the age will increase slowly with depth, and if the recharge rate is low, age will increase rapidly with depth. Although it is not necessarily intuitive, Vogel (1967) showed that if recharge is constant across an aquifer, then the age profile will also be constant, and contours of groundwater age will be horizontal (Figure 14). The curvature of flow lines means that vertical water velocity decreases with depth (and is zero at the base of the aquifer). Thus, not only does groundwater age increase with depth, but it does so more rapidly towards the base of the aquifer. The groundwater age profile will therefore be concave upward (Figure 15).
For an aquifer of uniform geology, constant thickness (H), and receiving constant recharge (R), the groundwater age (t) as a function of depth below the water table (z) will be given by Equation 10.
 |
(10) |
where:
| θ | = | porosity |
The vertical component of the groundwater velocity will decrease from R/θ at the water table to zero at the base of the aquifer. If groundwater age is measured at any discrete depth, then the recharge rate can be determined by re-arrangement of Equation 10. However, if sampling takes place near the water table (z/H small) then the recharge rate may be approximated by Equation 11.
 |
(11) |
where:
| z | = | depth below the water table (L) |
In fact, comparison of evaluations of Equation 10 and 11 reveals that the error resulting from using Equation 11 instead of Equation 10 will be less than 20 percent if samples for age measurement are collected from within the top third of the aquifer.
In principle, a single measurement of groundwater age at a discrete depth can be used to estimate recharge, but accuracy is significantly improved if vertical profiles can be obtained. For example, a detailed vertical profile of CFC-12 concentrations from a shallow silty sand aquifer near Sturgeon Falls, Ontario, Canada (Figure 16), enabled recharge to be estimated with high precision. At this site, the saturated unconfined aquifer is about 35 m thick and water table depth varies seasonally between approximately 0.2 m in spring and 2 m in late summer. Piezometers are located between approximately 1 and 20 m depth, with screen lengths of 15 cm. The wells were sampled in 1993 for analysis of dissolved concentrations of CFC-11, CFC-12 and CFC-113, although only results from CFC-12, the most conservative of the CFCs, are discussed here. The observed CFC-12 profile shows a gradual decrease in concentration with depth, reflecting a progressive increase in groundwater age with depth (Figure 17). The groundwater age at 12 m is estimated to be approximately 34 years, equivalent to a recharge year of 1959. Below 13 m calculated ages are artificially low, due to trace contamination (probably introduced during sampling) and low measured concentrations. The year 1960 is sometimes considered to be the limit of groundwater dating with CFCs, although reliable dates from the late 1950s can sometimes be obtained.

The measured CFC-12 data were used to calibrate a two-dimensional numerical flow and solute transport model for this site, and hence estimate a vertical recharge rate of approximately 130 mm/y. This is reasonable as it is about 14 percent of the average annual precipitation of about 900mm/y for the locale. A similar recharge rate would have been derived by applying Equation 10 or 11 to measured CFC-12 ages. Simulations were also performed using recharge rates of 110 mm/y and 150 mm/y, and these significantly under-estimate and over-estimate measured values, respectively, indicating an uncertainty of estimated recharge of better than 15 percent (Cook et al., 1995).

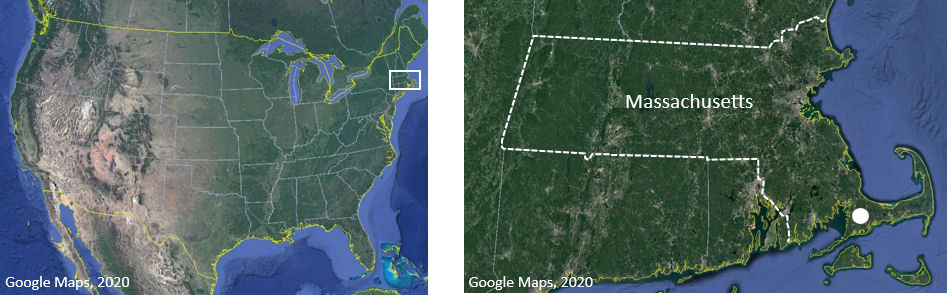
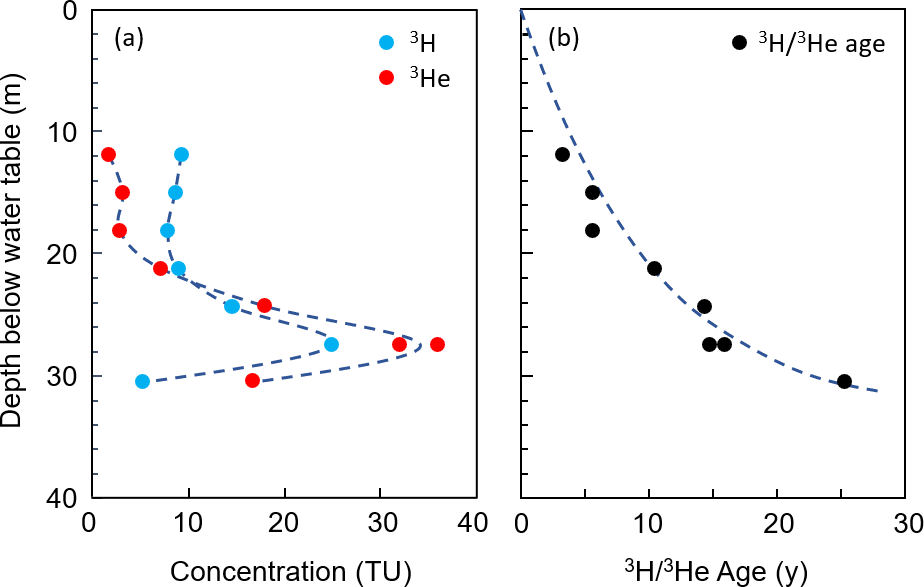
In another example, a vertical profile of 3H and 3He concentration was obtained from a multi-level well in the shallow, sand aquifer at Cape Cod, Massachusetts, USA (Figure 18), as part of an investigation into the transport of organic contaminants (Solomon et al., 1995). The water table ranged from about 20 to 30 m below ground surface, and peaks of 3H and 3He occurred at approximately 27 m below the water table (Figure 19). The increase in apparent 3H/3He age with depth can be reproduced using Equation 10. Assuming an aquifer thickness of 33 m and the measured ages, the vertical water velocity at the water table (R/θ) is about 3.3 m/y. Assuming a porosity of θ = 0.35 and solving for recharge, gives R = 115 mm/y. This is a reasonable value given the average annual precipitation of about 1000 mm/y. At this site, sampling occurred in 1993, approximately 30 years after the peak of 3H in rainfall. The 3H/3He age at the depth of the peak concentration of 3H in the groundwater is about 16 years, thus the water must have taken about 14 years to travel through the unsaturated zone. Estimates of recharge were used to estimate the horizontal flow velocity, and hence estimate the rate of plume movement at the site, as described in Section 3.9.
Such high-precision estimates of groundwater recharge are only possible where vertical profiles can be obtained using wells with short screened intervals. Typically, existing wells must be used to gather groundwater samples and such wells generally have long screened intervals. On the Eyre Peninsula, South Australia (Figure 20), groundwater is used for irrigation and to augment the drinking water supply. Approximately 20 wells, with screen lengths ranging from about 2 to 10 m, were sampled throughout the region (Figure 21). Since these wells are distributed across a large area and recharge is likely to be spatially variable, a plot of CFC-12 versus depth from all of the wells does not reveal a smooth profile. Nevertheless, in general throughout the area, shallow wells have higher concentrations than deeper wells. Each measured CFC-12 concentration represents the average age of the groundwater over the entire screened-interval of the well. Recharge rates can be obtained by comparison to results from a one-dimensional numerical groundwater model of flow and transport. However, the recharge rate that is calculated will depend on whether the groundwater is assumed to be derived from near the top of the screen, from near the bottom, or derived evenly across the entire screened interval. The problem is most pronounced for wells that are screened close to the water table. If it is assumed that water is derived evenly across the screened intervals of the wells, then most wells have recharge rates between approximately 20 and 50 mm/y (Cook et al., 1996). This is a reasonable range for an area with precipitation of about 400 mm/y. One well, screened between approximately 11 and 13 m depth, had a measured CFC-12 concentration of 50 pg/kg. This reflects an atmospheric concentration of approximately 100 parts per trillion by volume (pptv) based on an assumed recharge temperature of 15°C, equivalent to a recharge year of 1968, and hence an age of 27 years because sampling took place in 1995. The recharge rate for this well is estimated to be approximately 100 – 140 mm/y. This high rate is surprising considering the arid environment and may represent fracture or macropore flow through the limestone. Comparison of Figures 17, 19 and 21 clearly shows the advantage of short well screens for accurate estimation of groundwater recharge from tracer data.