
5.1 Background and Historical Development
[latex]{SF}_{6}[/latex] is a colorless, odorless, and nonflammable gas that is commonly used as an electrical insulator and blanket gas in high‑temperature metal working operations. It has an octahedral geometry and is relatively stable in the atmosphere with an estimated lifetime of more than 1,000 years (Kovács et al., 2017). Industrial production of [latex]{SF}_{6}[/latex] began in 1953 with a reported production of 9.04 Gg/yr in 2018, most of which was from the electrical power industry (Simmonds et al., 2020). Natural sources of [latex]{SF}_{6}[/latex] to the atmosphere appear to be small but may be significant for groundwater as discussed in Section 6.6 (Harnisch & Eisenhauer, 1998; Busenberg & Plummer, 2000).
[latex]{SF}_{6}[/latex] is a potent greenhouse gas with warming potential that is 23,900 times that of [latex]{CO}_{2}[/latex] (Intergovernmental Panel on Climate Change, 1995). Although [latex]{SF}_{6}[/latex] was included in the Kyoto Protocol to the UN Framework Convention on Climate Change (UN, 1998), controls on releases apply only to developed countries. As of 2018, atmospheric concentrations continue to rise with no sign of a decline in the annual rate of rise.
The natural background concentration (i.e., atmospheric concentration prior to 1953) of [latex]{SF}_{6}[/latex] has been estimated to be between 0.001 and 0.04 parts per trillion by volume (pptv) (Harnisch & Eisenhauer, 1998; Maiss & Brenninkmeijer, 1998). The earliest measurements of atmospheric [latex]{SF}_{6}[/latex] in the 1970s reported values of less than 1 ppt (Krey et al., 1977; Lovelock, 1971). Watson and Liddicoat (1985) reconstructed the atmospheric history of [latex]{SF}_{6}[/latex] for the 1970s and early 1980s using depth profiles from the ocean.
Routine measurements of atmospheric [latex]{SF}_{6}[/latex] began in 1995 as part of the Global Monitoring Laboratory (GML) of the National Oceanic and Atmospheric Administration (NOAA) in the USA. The atmospheric mixing ratio1 for [latex]{SF}_{6}[/latex] in both the northern and southern hemispheres is shown in Figure 20. The southern hemisphere curve lags the northern hemisphere by about 1.5 years because more [latex]{SF}_{6}[/latex] sources are in the northern hemisphere and interhemispheric mixing is slow. Since the mid‑1980s the atmospheric concentration has increased by seven to eight percent each year.
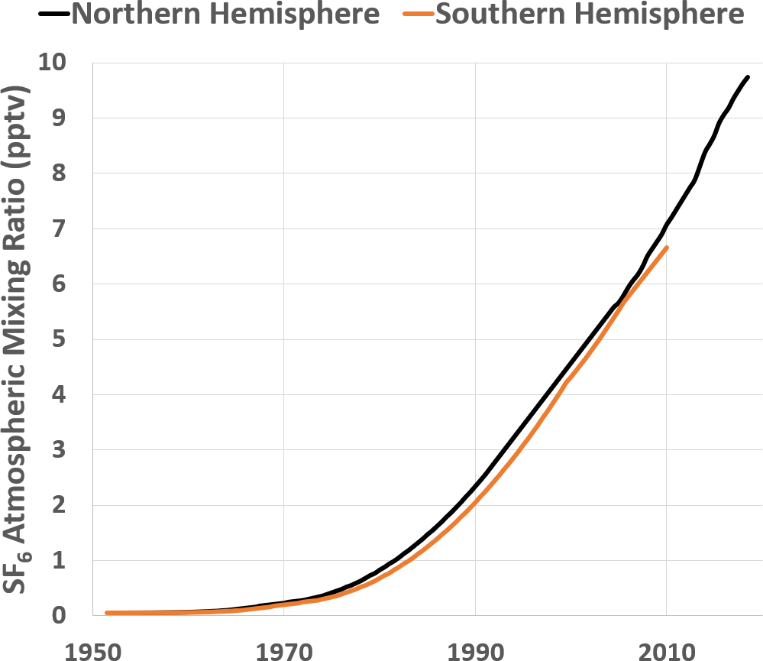
Figure 20 ‑ SF6 atmospheric mixing ratio for northern and southern hemispheres. Since the mid‑1980s, the annual increase has been approximately seven to eight percent.
Biodegradation and sorption of [latex]{SF}_{6}[/latex] in the subsurface do not appear to be significant (Wilson & Mackay, 1996) and, as [latex]{SF}_{6}[/latex] is not used in common household products, neither is contamination of groundwater in urban regions (Busenberg & Plummer, 2000).
1In atmospheric science, it is common to express gas concentrations as a mixing ratio, which is the moles of a given gas divided by the moles of all other gases in a mixture. The mole fraction is the moles of a given gas divided by the moles of all gases—including the given gas—in the mixture. When the moles of a given gas are much less than the total (i.e., for trace gases), the mixing ratio and mole fraction are essentially equivalent.