
4.4 Calculation of Tracer Age
Figure 15 shows five to six typical steps that can be followed to determine [latex]_{}^{3}H[/latex]/[latex]_{}^{3}{He}[/latex] age from noble gas and tritium data. Step 1 is a data triage step to evaluate whether the groundwater sample is likely to be in the applicable age range for the [latex]_{}^{3}H[/latex]/[latex]_{}^{3}{He}[/latex] method and evaluate whether the sample may be a mixture of old and young groundwater (Step 1d). A key variable in step 1 is [latex]\frac{R}{R_{a}}[/latex], which is the ratio of [latex]_{}^{3}{He}[/latex] to [latex]_{}^{4}{He}[/latex] measured in the sample ([latex]R)[/latex] and the [latex]_{}^{3}{He}[/latex]/[latex]_{}^{4}{He}[/latex] of air ([latex]R_{a}[/latex]) as shown in Figure 15, steps 1a, b, and d. Either [latex]\frac{R}{R_{a}}[/latex] or the [latex]R[/latex] measured for each groundwater sample should be included in the results reported by the noble gas laboratory analyzing the samples.
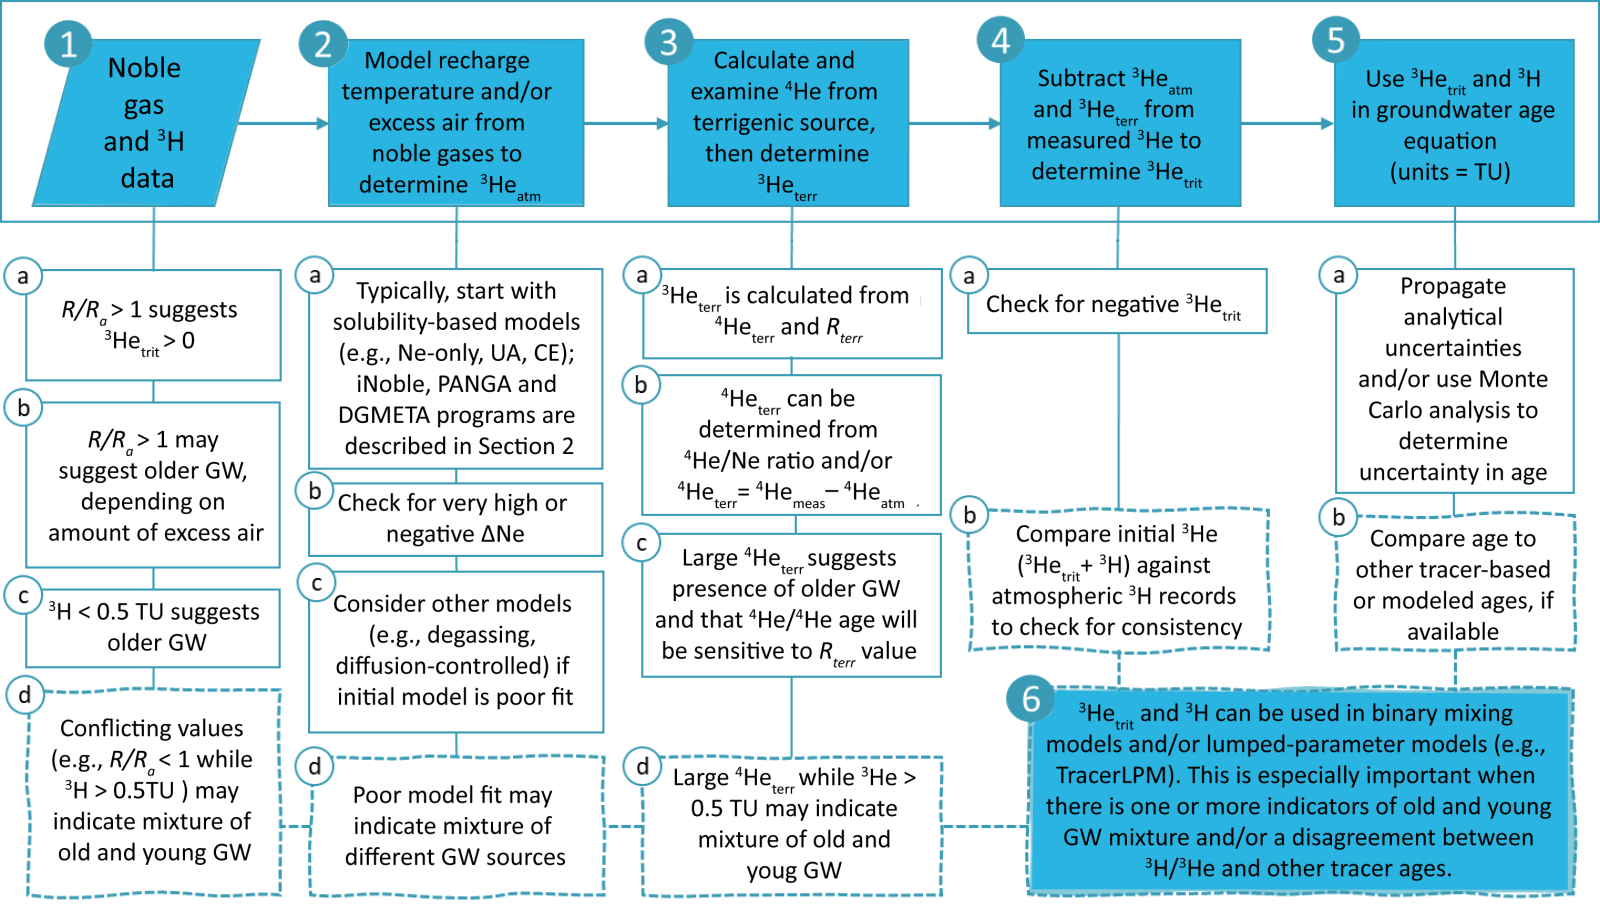
Figure 15 – The process for interpreting 3H and noble gas data for tritium‑helium age dating. Shaded and numbered boxes are major steps of the process. Text boxes below the first five steps show key criteria to consider while interpreting noble gas and 3H data. Dashed lines and outlines indicate special consideration for samples that may be mixtures of old and young groundwater (modified from Gilmore et al., 2021).
Inspection of the tritium‑helium age calculation shown in Equation (14) reveals the need to determine [latex]_{}^{3}{He}_{trit}[/latex], which is just one component of the overall [latex]_{}^{3}{He}[/latex] budget in any groundwater sample. The complete budget for [latex]_{}^{3}{He}[/latex] in groundwater, rearranged to solve for [latex]_{}^{3}{He}_{trit}[/latex], is shown in Equation (18).
| [latex]_{\ }^{3}{He}_{trit} =_{\ }^{3}{He}_{m} -_{\ }^{3}{He}_{atm} -_{\ }^{3}{He}_{terr}[/latex] | (18) |
|---|
where:
| [latex]_{\ }^{3}{He}_{m}[/latex] | = | [latex]_{}^{3}{He}[/latex] measured in the groundwater sample |
|---|---|---|
| [latex]_{\ }^{3}{He}_{atm}[/latex] | = | portion of dissolved [latex]_{}^{3}{He}[/latex] derived from atmospheric sources |
| [latex]_{\ }^{3}{He}_{terr}[/latex] | = | portion of dissolved [latex]_{}^{3}{He}[/latex] derived from terrigenic sources, including crustal [latex]_{}^{3}{He}[/latex] ([latex]_{}^{3}{He}[/latex]crust) and mantle [latex]_{}^{3}{He}[/latex] ([latex]_{}^{3}{He}[/latex]man) |
Units for concentrations in Equation (18) are typically expressed in ccSTP/g. [latex]_{\ }^{3}{He}_{m}[/latex] may be reported as [latex]\delta_{}^{3}{He}[/latex], which is equivalent to [latex]\left( \frac{R}{R_{a} - 1} \right)100\%,[/latex] and can therefore be converted to ccSTP/g based on the definitions of [latex]R[/latex] and [latex]R_{a}[/latex] and the measured concentration of [latex]_{}^{4}{He}[/latex] in ccSTP/g. The age calculated by Equation (14) requires that [latex]_{}^{3}H[/latex] and [latex]_{\ }^{3}{He}_{trit}[/latex] be in the same units. Equation (19) expresses a conversion factor (CF) used to convert from ccSTP/g to TU.
| [latex]CF = \left( \frac{4.021 \times 10^{14}}{1 - \frac{S}{1000}} \right)[/latex] | (19) |
|---|
where:
| S | = | salinity of the sample in parts per thousand (i.e., ‰) |
|---|
Determination of the atmospheric component ([latex]_{\ }^{3}{He}_{atm}[/latex]) of the [latex]_{}^{3}{He}[/latex] budget is addressed in Figure 15 (step 2). [latex]_{\ }^{3}{He}_{atm}[/latex] can be broken into two components as shown in Equation (20).
| [latex]_{\ }^{3}{He}_{atm} =_{\ }^{3}{He}_{sol} +_{\ }^{3}{He}_{EA}[/latex] | (20) |
|---|
where:
| [latex]_{\ }^{3}{He}_{sol}[/latex] | = | [latex]_{}^{3}{He}[/latex] concentration at solubility equilibrium with the atmosphere at recharge temperature and elevation |
|---|---|---|
| [latex]_{\ }^{3}{He}_{EA}[/latex] | = | the portion of dissolved [latex]_{}^{3}{He}[/latex] derived from excess air |
[latex]_{\ }^{3}{He}_{EA}[/latex] describes dissolved [latex]_{}^{3}{He}[/latex] attributed to an atmospheric source but in excess of solubility equilibrium at recharge temperature and elevation. Excess air is due to vadose zone processes and/or water table dynamics (i.e., dissolution of air that is trapped in pore spaces as described in Section 2). Selection of a noble gas model as described in Section 2 (e.g., the CE model or graphical method shown in Figure 5) or in Aeschbach‑Hertig and Solomon (2013) is necessary to determine the solubility and excess air components of the [latex]_{\ }^{3}{He}_{atm}[/latex] budget.
∆[latex]Ne[/latex]—defined in Equation (8) of Section 2—is an important variable mentioned in Figure 15 (step 2b) because it is sensitive to excess air (Figure 5). When ∆[latex]Ne[/latex] is negative, it is likely that noble gases have been lost from the sample (Figure 6: steps 2b and c) and noble gas modeling becomes more complex (Aeschbach‑Hertig et al., 2008; Aeschbach‑Hertig & Solomon, 2013; Gilmore et al., 2021; Gilmore, Genereux, Solomon, Farrell, et al., 2016; Gilmore, Genereux, Solomon, & Solder, 2016; Visser et al., 2007; Visser et al., 2009), as described in the discussion of tracer‑specific issues in Section 4.6.
Step 3 in Figure 15 addresses the [latex]_{\ }^{3}{He}_{terr}[/latex] component of the [latex]_{}^{3}{He}[/latex] budget, which is based on an estimate or assumption of [latex]R_{terr}[/latex](Figure 15: steps 3a and c), the [latex]\frac{_{}^{3}{He}}{_{}^{4}{He}}[/latex] of terrigenic [latex]He[/latex]. The typical assumed value for [latex]R_{terr}[/latex] is 2 × 10‑8 (Mamyrin & Tolstikhin, 1984), with a range of 10-9 to 10-7 (Solomon, 2000), based on values associated with a crustal source ([latex]R_{crust}[/latex] in Table 4). If a mantle source ([latex]R_{man}[/latex], Table 4) of [latex]He[/latex] is present, age dating becomes very difficult because the [latex]R_{man}[/latex] is an order of magnitude greater than [latex]R_{a}[/latex] for atmospheric [latex]He[/latex].
Table 4 ‑ 3He/4He ratios (Rx) for different 3He reservoirs (i.e., sources).
| 3He reservoir | Variable | Typical Value | Notes |
|---|---|---|---|
| Atmosphere | Ra | 1.382[latex]\mathbf{\times}[/latex]10-6 |
|
| Atmosphere, adjusted for fractionation | Rsol | 1.357[latex]\mathbf{\times}[/latex]10-6 |
|
| Crustal source of Rterr | Rcrust | 2[latex]\mathbf{\times}[/latex]10-8, theoretically, although in practice may reach 2[latex]\mathbf{\times}[/latex]10-7 |
|
| Mantle source of Rterr | Rman | 1.1[latex]\mathbf{\times}[/latex]10-5 to 1.4[latex]\mathbf{\times}[/latex]10-5 |
|
Step 4 in Figure 15 is trivial if the calculated [latex]_{\ }^{3}{He}_{trit}[/latex] is positive and initial tritium, [latex]_{}^{3}{He}[/latex](t0) as determined using Equation (16) is reasonable compared to historical atmospheric [latex]_{}^{3}H[/latex] records. Similarly, Step 5 is a simple calculation of groundwater tracer age based on Equation (14). However, it is important to perform the checks a and b for Steps 4 and 5 to confirm that the calculated age is reasonable. An example of a graph used for Step 4b is shown in Figure 16. Samples that plot below the precipitation curve are likely to be mixtures of young and old water. When appropriate, tracer results need to be modeled as mixtures of groundwater with different ages, as described in Step 6 of Figure 15.
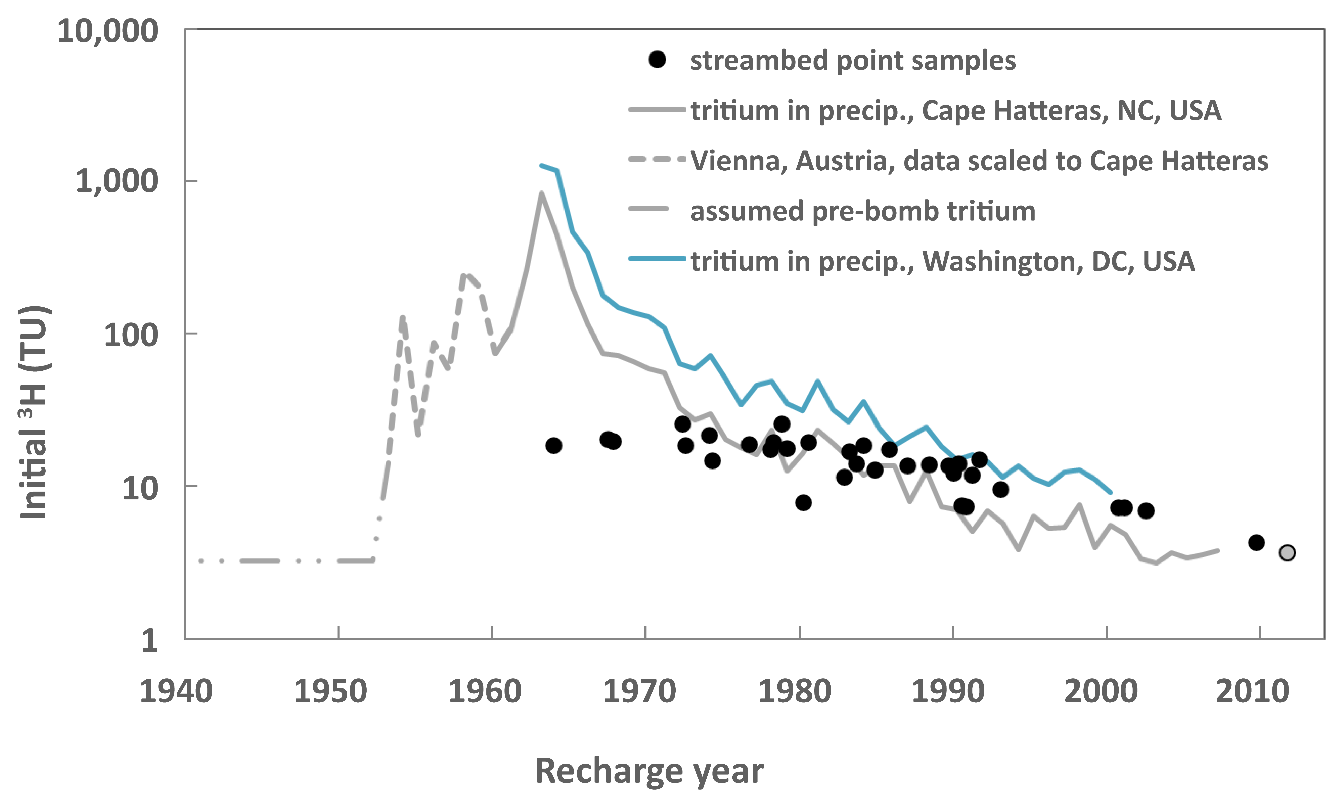
Figure 16 – Graph showing initial tritium (3H(t0), calculated from measured 3H plus 3H equivalent of tritiogenic helium from the sample) for groundwater samples collected in the streambed of a gaining stream in North Carolina (NC), USA, in July 2012 (modified from Gilmore, Genereux, Solomon, & Solder, 2016). Black dots are streambed samples with the initial 3H on the y‑axis and recharge year determined from tracer age using the 3H/3He method on the x‑axis.