
5.2 Basic Concepts and Systematics
Lovelock (1971) was the first to recognize the potential of [latex]{SF}_{6}[/latex] as a tracer in the atmosphere and oceans. Busenberg and Plummer (2000) reported [latex]{SF}_{6}[/latex] measurements in groundwater and described its use as a dating tool. The basic concept of [latex]{SF}_{6}[/latex] dating is shown in Figure 21. Samples are collected such that they do not contact the atmosphere. The aqueous concentration is measured by gas chromatography after the [latex]{SF}_{6}[/latex] has been extracted (stripped) from the water sample. The aqueous concentration is then converted into an air concentration using Henry’s Law (i.e., the air concentration that is in equilibrium with the measured aqueous concentration at assumed temperature, pressure, and salinity at recharge). The equivalent air concentration is then compared to the atmospheric concentration curve to estimate the year the sample was last in contact with the atmosphere (the recharge year). The tracer age is simply the sample collection date minus the recharge year. The conversion from an aqueous concentration to an equivalent air concentration, or mixing ratio, utilizes Henry’s Law with a coefficient that is temperature dependent.
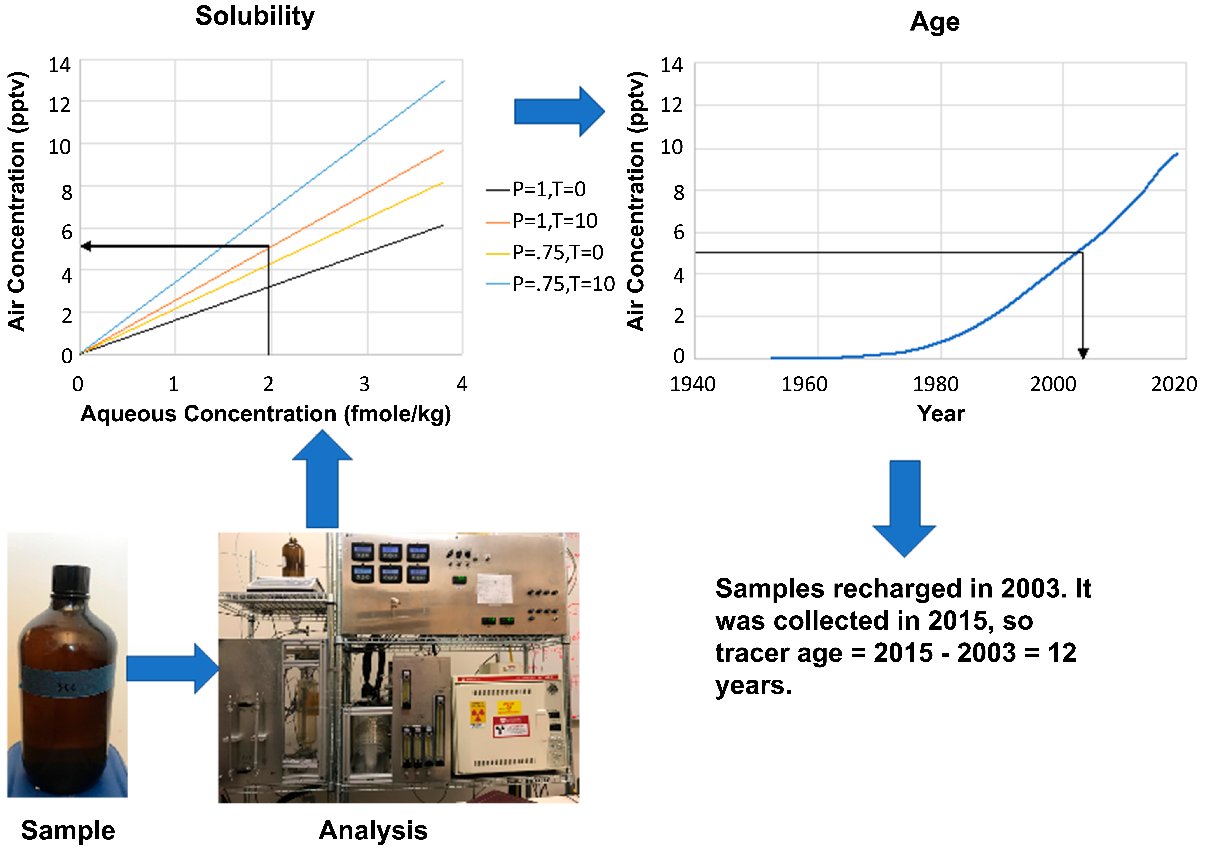
Figure 21 ‑ General concept of groundwater dating with SF6. The aqueous concentration of SF6 is measured by gas chromatography. Using estimates of the recharge temperature and pressure (elevation) the aqueous concentration is converted to the air concentration (i.e., the concentration in air that would be in equilibrium with the measured aqueous concentration at the temperature and pressure when the sample was at the water table). Using the atmospheric concentration curve, the air concentration is converted into a recharge year. For a water sample with an aqueous concentration of 2 femtomole/kg that recharged at a pressure of 1 atm (i.e., sea level) with a water table temperature of 10 °C—and assuming no excess air—the equivalent air concentration would be about 5.1 pptv. The atmosphere had a concentration of 5.1 pptv in 2003 and the sample was collected in 2015. Thus, the tracer age is 2015 − 2003 = 12 years.
The example solubility curves shown in Figure 21 were computed for two recharge temperatures and two recharge pressures (elevations). In practice, a solubility curve is computed for the exact recharge temperature and pressure conditions for a sample. Also, the measured concentration can include excess air, as discussed in Section 2, that needs to be removed from the measured concentration before an equivalent air concentration is computed as presented in Section 5.4.