
3.1 Background and Historical Development
Prior to the nuclear era, the primary source of [latex]_{}^{3}H[/latex] in the hydrosphere was the result of cosmic rays interacting with nitrogen and oxygen (Kaufman & Libby, 1954). Because the cosmic ray flux depends on latitude, the natural production of [latex]_{}^{3}H[/latex] also depends on latitude, with production being greatest at the poles. Prior to 1950, the [latex]_{}^{3}H[/latex] content of precipitation ranged from 3 to 6 TU in Europe and North America (Kaufman & Libby, 1954), 1 to 3 TU in Australia (Allison & Hughes, 1977), and approximately 15 TU in Antarctica (Begemann & Libby, 1957; Taylor, 1968). The global inventory of [latex]_{}^{3}H[/latex] prior to 1950 was estimated to be 3.5 kg (O’Brien, 1979).
Numerous nuclear reactions can produce [latex]_{}^{3}H[/latex] in the subsurface (Davis & Murphy, 1987), but the most significant for hydrologic studies is the fission of lithium‑6 ([latex]_{}^{6}{Li}[/latex]) by neutrons that are mostly generated by the decay of uranium- ([latex]U[/latex]) and thorium‑series ([latex]Th[/latex]) nuclides (Andrews & Kay, 1982). Average concentrations of [latex]U[/latex], [latex]Th[/latex], and [latex]Li[/latex] in crustal rocks suggest that the subsurface production of [latex]_{}^{3}H[/latex] should generally be 0.2 TU or less (Lehmann et al., 1993).
Beginning in the early 1950s, atmospheric [latex]_{}^{3}H[/latex] values rose sharply as the result of above‑ground testing of thermonuclear weapons. As shown in Figure 7, [latex]_{}^{3}H[/latex] values in precipitation rose to more than 5,000 TU in Canada in 1963 and then declined as a result of a ban on above‑ground testing. Peak values in the southern hemisphere were much lower and lagged in time because weapons testing primarily occurred in the northern hemisphere and interhemispheric mixing is slow. For example, the maximum [latex]_{}^{3}H[/latex] observed in Kaitoke, New Zealand, was about 75 TU in 1966.
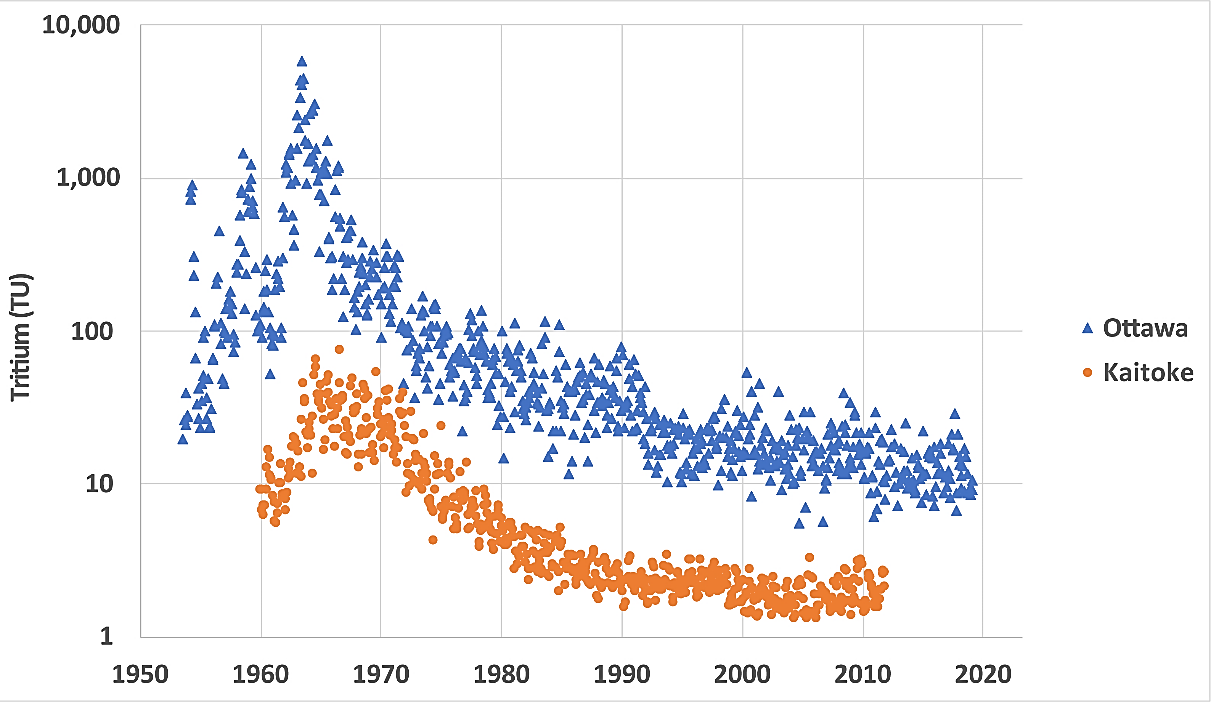
Figure 7 ‑ Tritium in precipitation in Ottawa, Canada, in the northern hemisphere and Kaitoke, New Zealand, in the southern hemisphere (IAEA/WMO, 2020).
Between 1952 and 1953, approximately 600 kg of [latex]_{}^{3}H[/latex] was injected into the atmosphere (Rozanski et al., 1991). The beta decay energy of [latex]_{}^{3}H[/latex] is low (18.6 keV) and the recommended limit in drinking water by the World Health Organization (WHO) is about 85,000 TU (WHO, 2008), which is far greater than peak concentrations in the 1960s.
The spike-like injection of [latex]_{}^{3}H[/latex] into the atmosphere created an event marker for hydrologic studies. Historically, a common use of [latex]_{}^{3}H[/latex] in groundwater studies was to distinguish pre‑ from post‑bomb water. In 1990, it was possible to distinguish pre‑ and post‑bomb water with a [latex]_{}^{3}H[/latex] detection limit of 0.6 TU—a typical value for analytical laboratories at that time; current detection limits are lower. This distinction is no longer possible in some areas with a detection limit of 0.6 TU (Eastoe et al., 2012). However, as is discussed subsequently, it is possible to estimate a minimum age for a given detection limit and natural background value.
In addition to spatial variations resulting from variations in the flux of cosmic rays and the location of nuclear weapons testing, temporal variation also exists in atmospheric [latex]_{}^{3}H[/latex] values. From the mid‑1960s to the mid‑1990s, the most prominent temporal change was an exponential decrease as bomb [latex]_{}^{3}H[/latex] decayed and rained out of the atmosphere. Since about 1990 in the southern hemisphere and 2000 in the northern hemisphere, atmospheric [latex]_{}^{3}H[/latex] values appear to have reached steady‑state levels. Most naturally produced and bomb‑derived [latex]_{}^{3}H[/latex] in the atmosphere resides in the stratosphere (Rozanski et al., 1991). Transfer of [latex]_{}^{3}H[/latex] from the stratosphere to troposphere results from eddy diffusion and injections by the jet stream, and by the so‑called spring leak. The latter results from a seasonal rise in the tropopause at high latitudes that occurs in the spring. In the northern hemisphere, [latex]_{}^{3}H[/latex] values are typically at a maximum from May to July and in the southern hemisphere from August to September (Rozanski et al., 1991). An example of temporal variations in atmospheric [latex]_{}^{3}H[/latex] in Vienna, Austria, is shown in Figure 8. The average [latex]_{}^{3}H[/latex] value in Vienna for the period from 2000 to 2021 is 10.5 TU with a standard deviation of 2.8 TU (coefficient of variation = 26 percent).
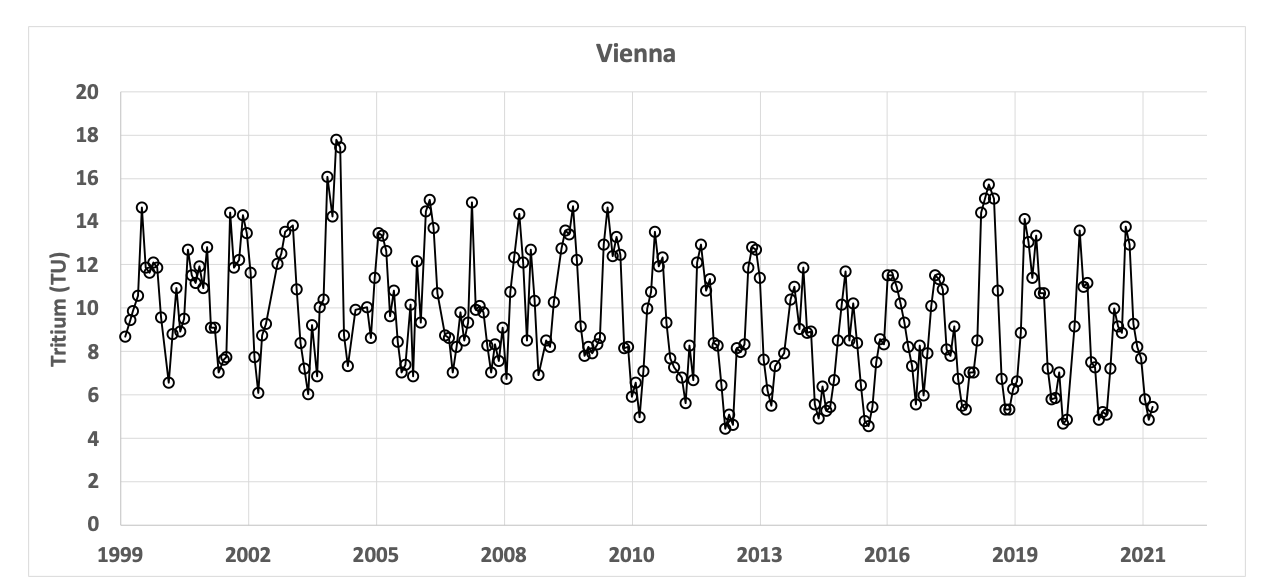
Figure 8 ‑ Temporal variations in 3H in precipitation in Vienna, Austria (IAEA/WMO, 2020).
Local sources of [latex]_{}^{3}H[/latex] exist in the vicinity of nuclear reactors and nuclear processing facilities. A variety of reactions in nuclear power plants produce [latex]_{}^{3}H[/latex]; it is ultimately transferred to cooling water and then discharged to the environment. Such releases are often episodic, leading to short‑term spikes in rivers in the vicinity of power plants. In continental precipitation, [latex]_{}^{3}H[/latex] values are higher than ocean precipitation due to factors including cyclical neutron fluxes, stratospheric inputs, distance from tropospheric moisture sources (Terzer‑Wassmuth et al., 2022), and the location of anthropogenic nuclear sources.
When surface water evaporates, a modest fractionation of dissolved gas occurs as the vapor pressure for the light isotopes of water is larger than that of the heavier isotopes. At equilibrium, the ratio of the [latex]_{}^{3}H[/latex] concentration in the vapor phase to that of the liquid phase is about 0.86 at 0 °C and 0.96 at 70 °C (Sepall & Mason, 1960). This results in some surface water bodies being modestly enriched in [latex]_{}^{3}H[/latex] over local precipitation (Brown & Barry, 1979) with greater enrichment in colder climes.
The Global Network of Isotopes in Precipitation (GNIP) database is maintained by the International Atomic Energy Agency (International Atomic Energy Agency/World Meteorological Organization (IAEA/MO), 2020). Terzer‑Wassmuth and others (2022) used it to modify a cluster‑based water isotope model for stable isotopes to predict annual average [latex]_{}^{3}H[/latex] values in modern (i.e., post‑2000) precipitation. The global distribution of contemporary [latex]_{}^{3}H[/latex] in precipitation has also been simulated with atmospheric, general‑circulation models (Cauquoin et al., 2015) to evaluate inputs to both the oceans and continents. (Oms et al., 2019). These models reveal spatially variable [latex]_{}^{3}H[/latex] values in contemporary precipitation ranging from 1 to 25 TU that are sufficiently predictable for practical hydrological applications (Terzer‑Wassmuth et al., 2022). Key variables in the global model of Terzer‑Wassmuth and others (2022) for predicting the spatial patters of [latex]_{}^{3}H[/latex] in precipitation include air temperature, latitude, land mass fraction, and distance from the sea coast.