4.2 Hydraulic Head
Water moves through a groundwater system because it is acted upon by forces. There are two forces that drive flow: 1) a pressure gradient and 2) the force of gravity. If the density of the groundwater is constant, the sum of these forces acting on a unit weight of water can be conveniently expressed as the gradient of hydraulic head. Hydraulic head is a scalar quantity that has the potential for generating force. For this reason, it is sometimes called a force potential. A scalar quantity is one that can be represented by a single number describing magnitude. For example, temperature is a scalar. A gradient is a vector. A vector is described with two values: magnitude and direction. For example, velocity is a vector.
Both of the forces on groundwater are mechanical, so hydraulic head is thought of as mechanical energy and is defined as the mechanical energy per unit weight of water. It is composed of two components: potential energy from the water’s elevation in the gravitational field and potential energy from the fluid pressure distribution as shown in Equation 19. These are often referred to as the elevation head and the pressure head as shown in Equation 20.
 |
(19) |
where:
| h | = | hydraulic head (L) |
| z | = | elevation of measurement point (L) |
| p | = | water pressure at measurement point (F/L2, force (weight) per unit area) |
| ρ | = | water density (M/L3) |
| g | = | gravitational constant (acceleration of gravity) (L/T2) |
| h = hz + hp | (20) |
where:
| h | = | hydraulic head (L) |
| hz | = | elevation head (L) |
| hp | = | pressure head (L) |
The components of elevation head and pressure head are illustrated for a laboratory and a field setting in Figure 19. Hubbert (1940) recognized the head gradient drives groundwater flow and defined fluid potential (Φ) as the product of head and the gravitational constant (gh), yielding mechanical energy per unit mass. He stated that groundwater always moves from areas of high fluid potential to low fluid potential. Hydraulic head (mechanical energy per unit weight) is the most commonly used term to define the force potential that drives groundwater flow as it is easily represented by a water level elevation measured in a piezometer or well.
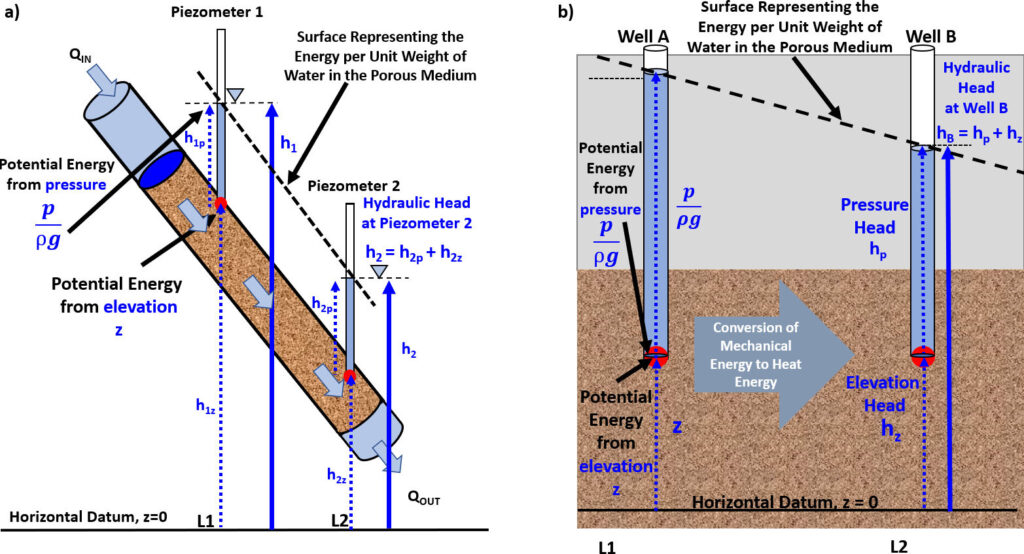
As water flows through porous media, the hydraulic head along a flow line gradually decreases as the fluid interacts with the pore walls resulting in conversion of a portion of the mechanical energy to thermal energy (Figure 17b). Physically, water warms in the direction of flow, however, changes in temperature are below detection in most settings.
The direction of flow is always from high to low hydraulic head regardless of the orientation or position of the porous medium in space. This is illustrated in Figure 20 where water flow is shown in a number of inclined, saturated, sand-filled cylinders. The hydraulic head is higher on the end of the cylinder where water is introduced and lower as water moves along the flow path. The white arrow shows the direction in which water is moving through the columns.

As noted earlier, hydraulic head is sufficient to describe the distribution of the mechanical energy of groundwater in most groundwater projects because the fluid density is constant in space and time. Commonly, under ordinary conditions groundwater temperature and chemical variations do not significantly affect the density of the fluid so density is constant throughout the system. When wells sample groundwater that varies in density, head calculations must include adjustment to pressure heads that allow for reasonable comparisons. It is best to assess groundwater flow under variable density conditions using computer codes designed to account for the density variations. Click here to link to Box 3 which presents a more detailed discussion of how hydraulic head is related the force potential that drives fluid flow, including situations when the fluid density varies due to variation of temperature and/or dissolved substances.
Representing Hydraulic Head Distributions
Multiple measurements of hydraulic head obtained from laboratory piezometers or monitoring wells in the field are used to represent the spatial head distribution. This can be illustrated by examining the head distribution in a column filled with sand and penetrated by a number of piezometers (Figure 21). Darcy’s Law indicates that the head distribution will be linear along a homogeneous sand column because the flow is uniform and one dimensional (uniform means each packet of water moves along its path with constant speed and the flow per unit area is constant and one dimensional means flowing in only one direction). Consequently, the lines of equal hydraulic head (equipotential lines) within the porous medium are straight, equally spaced, parallel to each other, and perpendicular to the column walls. Head decreases from h1 to h7 in the direction of flow as mechanical energy is converted to heat energy due to friction as water molecules flow by grain surfaces and other water molecules.

When head measurements are plotted in one-, two- or three dimensional space, they provide a framework for understanding groundwater flow patterns. In the one dimensional flow shown in Figure 21, the flow is in the direction of decreasing head, left to right. Hydraulic head distributions are typically represented as two-dimensional maps and cross sections of geologic settings containing a groundwater system. When head measurements are used to create a map, the head is plotted at the x,y location of the well on the land surface (Figure 22).

When head measurements are plotted in cross section, the head values are plotted at the x,z location of the point of measurement (the yellow dots in Figure 23). In order to evaluate vertical components of groundwater flow, it is common for multiple piezometers to be installed at the same x,y location in the field, with each piezometer open at a different depth, z, as shown in the laboratory column of Figure 23. Head measurements are taken from three piezometers at different depths along a vertical line in the middle of the cylinder. All head measurements in Figure 23a are 10 cm because flow parallels the cylinder walls, and the column is horizontal. When the column is rotated 42° around its axis at the bottom of the mid-depth piezometer (Figure 23b), flow is still parallel to the cylinder walls, but in this position, the shallow piezometer samples upgradient of the intermediate piezometer and the deep piezometer samples down gradient.


After head data are properly presented in space, the piezometer measurements are interpreted to infer groundwater flow directions. Interpretation of head distributions and groundwater flow directions are discussed later in Section 8 this book.