
8.6 Single Well Aquifer Tests
Our discussion of aquifer testing so far has dealt with collecting and analyzing data from an observation well located at distance ([latex]r)[/latex] from the pumping well. It is always better to use data from an observation well to determine aquifer parameters. However, practicing hydrogeologists quickly learn that observation wells might not be available and they may be too expensive to install specifically for testing purposes, so we often have no choice but to rely on analyzing the data from pumping wells to determine aquifer parameters.
Since the Cooper–Jacob simplification is valid for very small values of [latex]r[/latex], we can use the radius of the borehole of the well as [latex]r[/latex] and apply the time‑drawdown method to water level data collected from the well during the pumping test. This analysis can also be applied to analyzing the recovery data—that is, the recovery of water levels after pumping has ceased.
Limitations of Single Well Tests
Single‑well aquifer tests are useful and are often relied‑upon for characterization of aquifers; however, the following issues with analyzing time‑drawdown data from pumping wells should be acknowledged and understood.
Wellbore Storage
The objective of aquifer testing is to put a constant pumping stress on the aquifer; in other words, to continuously remove water from the aquifer at a constant rate and monitor changes in the aquifer during pumping. During the initial stages of pumping, the pump is removing water that is stored within the well under static conditions, and the removal of this water will affect the initial part of the drawdown curve. This is called the wellbore storage effect The portion of the drawdown curve affected by wellbore storage can be determined by:
- calculating the volume of water stored in the well above the drawdown depth using the radius of the well and the distance between the static water level and the drawdown water level;
- calculating the amount of time required to remove that volume of water given the pumping rate applied to the well for the test; and
- only analyzing the part of the drawdown curve after that time.
Care should be taken not to analyze the part of the drawdown curve that is affected by wellbore storage, as this can produce erroneous results.
Unreliable for Storage Parameters
The issues with wellbore storage generally do not affect the determination of [latex]T[/latex], if the proper part of the drawdown curve is analyzed. The wellbore storage effect, however, has a great impact on the aquifer storage response as perceived by the pumping well; therefore, aquifer storativity ([latex]S[/latex]) cannot be directly or reliably determined from the pumping well time‑drawdown data without complicated numerical modeling approaches. In general, reliable storativity cannot be determined from single well pumping tests.
Partial Penetration
The Theis equation assumes that all flow in the aquifer is horizontal and radial, which requires that the pumping well be completed across the entire saturated thickness of the aquifer. In many cases, the pumping well is only completed across the upper part of the aquifer. This is referred to as partial penetration (Figure 50). Partial penetration can affect the response of the aquifer to pumping and result in drawdowns that are greater than for a fully penetrating well. More information about partial penetration and methods for correcting the data and properly analyzing wells with partial penetration can be found in section 12.1.1 of An Introduction to Hydraulic Testing in Hydrogeology: Basic Pumping, Slug, and Packer Methods↗ by Woessner and others (2020) which is available as a free download from The Groundwater Project.
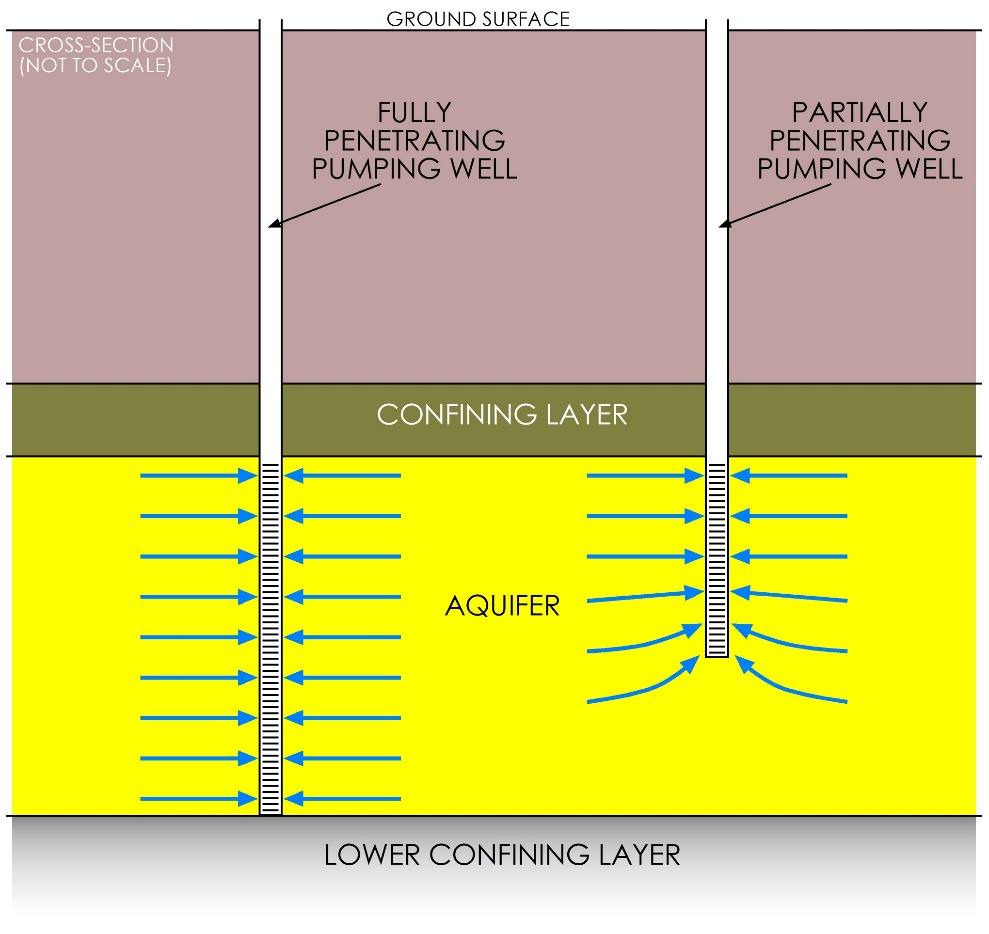
Figure 50 ‑ Schematic cross‑section showing two pumping wells completed in a confined aquifer. Pumping from the fully penetrating well on the left induces horizontal flow to the well (blue arrows) across the entire thickness of the aquifer with no vertical flow. Pumping from the partially penetrating well induces horizontal flow across the upper part of the aquifer and vertical flow from deeper portions.
Drawdown in a Pumping Well
Pumping from a well removes water from the aquifer, which in turn causes a reduction in hydraulic head—that is, it causes drawdown—which in turn causes a decline in water level in the well. If we were able to install a piezometer right at the edge of the borehole of a pumping well or otherwise monitor the change in hydraulic head in the aquifer right at the edge of the pumping well, we would see that the drawdown measured within the pumping well is greater than the drawdown in the aquifer next to the well, and the difference between the head in the pumping well and the head in the aquifer is related to the well efficiency. Efficiency is less than 100% because energy is lost as water enters the well bore, flows through the sand pack and the screen, then flows vertically in the well to the pump. Because the drawdown measured in the pumping well is greater than that measured in the aquifer, the drawdowns calculated by analyzing drawdown data from a pumping well will result in [latex]T[/latex] estimates that are not as reliable as those determined from analyzing data from an observation well. We discuss well efficiency in greater detail in Section 8.7.
Thought Question 9: If measured drawdowns in the pumping well are greater than those in the adjacent formation, how would that affect the transmissivity values estimated from a pumping well versus those from an observation well in the same aquifer during the same test? Would the T estimates from the pumping well be greater or less than those from the observation well?