
14.3 Movement of Water in the Vadose Zone
The ease with which water moves in the vadose zone is directly associated with the moisture content of the rock or sediments. Before we talk about the movement of water in the vadose zone, let’s have a quick review of the ways we express moisture content.
Moisture Content
We have already reviewed degree of saturation, which is the fraction of the pore space that is filled with water. Moisture content can also be expressed as a gravimetric moisture content—that is, moisture content by weight—or as a volumetric moisture content—that is, moisture content by volume. The gravimetric moisture content (ω) is the weight of water in the sample divided by the weight of the solids in the sample as expressed in Equation (107).
| [latex]\omega = \frac{{weight}_{water}}{{weight}_{solids}}[/latex] | (107) |
|---|
Volumetric moisture content (𝜃) is the volume of water in the sample divided by the total volume of the sample as shown by Equation (108).
| [latex]\theta = \frac{{volume}_{water}}{{volume}_{total}}[/latex] | (108) |
|---|
Note that volumetric moisture content is always some value less than the porosity of the rock.
Pore–Water Tension
In the vadose zone above the capillary fringe, water exists as a film or coating around the sediment or soil grains that is held to the grains by surface tension. This tension can be thought of as a negative pressure head or matric potential, and we commonly use [latex]\psi[/latex] to denote this quantity. The terminology is such that a higher matric potential is a lower (i.e., more negative) pressure.
Negative pore pressures in the unsaturated zone can be measured using an instrument called a tensiometer (Figure 113). A tensiometer consists of a sealed tube with a porous ceramic cup at one end and a pressure gauge on the other end. The tube is filled with water and sealed with the pressure gage set to zero so the pressure in the tube is the same as atmospheric pressure outside of the tube.
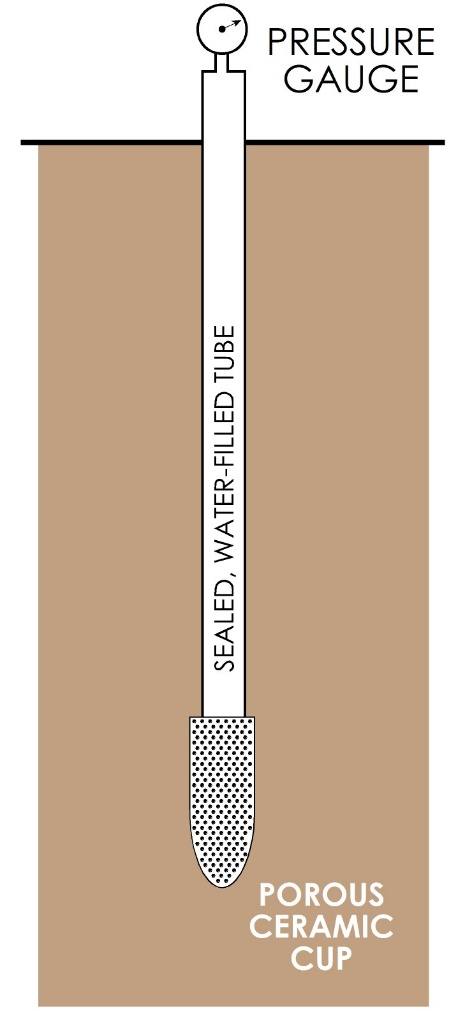
Figure 113 – Typical tensiometer design.
The tensiometer is inserted into the ground so that the ceramic cup is in contact with the soil. The negative pore pressures in the soil create a pressure gradient through the cup on the water in the tensiometer; these pressures are then transmitted to the pressure gauge. The amount of tension, or negative pressure head, is inversely related to the moisture content of the sediments (i.e., more-negative pressure values indicate lower moisture content).
With low moisture contents (Figure 114a), the film of water on the sediments is very thin, the volume of water in the film is small compared to the surface area of the water, and the surface tension is very high. When surface tension is high, the negative pressure head is high, and water movement is impeded by the surface tension. When moisture content is higher (Figure 114b), surface tension is lower, and water moves more easily.
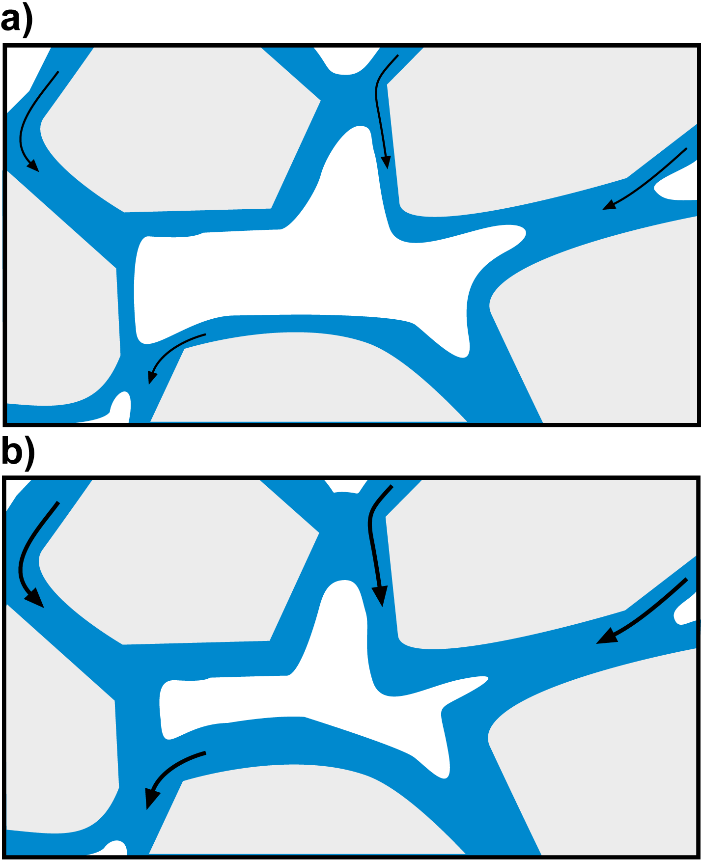
Figure 114 ‑ Pore fluid in the vadose zone with a) low moisture content and slow fluid movement indicated by the thin black arrows; and b) high moisture content with moisture moving more readily.
We can deduce that the permeability of sediments in the vadose zone is directly related to the moisture content. This is in fact true—increasing moisture content increases the permeability and decreasing moisture content decreases the permeability. The primary reason for this is that higher moisture content leads to more interconnection between pockets of fluid in the pores and the increased thickness of water on the pore walls provides a larger flow area. Unfortunately, the relationship is not linear—in fact, there is an extremely complicated relationship between moisture content and flow, and the theory of flow in the unsaturated zone is not as simple as in the saturated zone.
The general relationship between moisture content and these other parameters—matric potential and permeability—is shown in Figure 115. Permeability—that is, unsaturated hydraulic conductivity—increases as moisture content increases, while matric potential decreases with increasing moisture content. Matric potential is a negative number, and higher matric potential is a more negative pressure so decreasing matric potential (e.g., a value increasing from say -107 to -102) is related to a decrease in the force that pulls water to solid surfaces in the unsaturated zone. A decrease of matric potential also reflects an increase in moisture content. These combine to result in increased flow downward through the vadose zone.
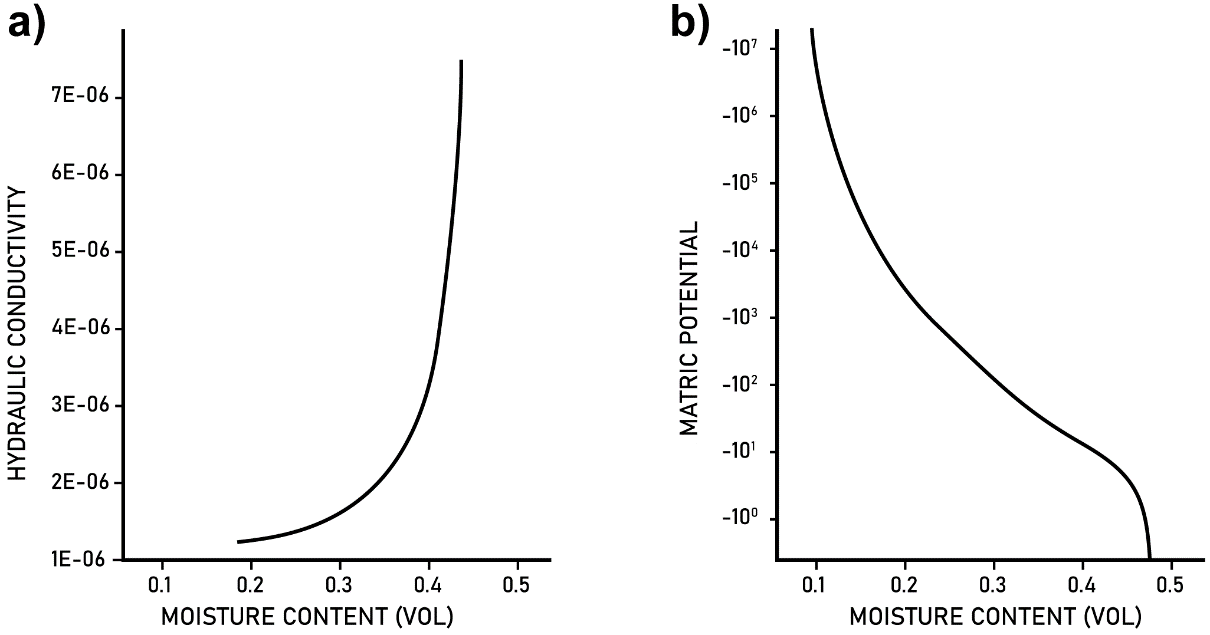
Figure 115 ‑ Graphs of a) hydraulic conductivity versus volumetric (vol) moisture content; and b) matric potential versus volumetric moisture content. It is useful to note that the y-axis of the graph in (b) is reversed such that the smaller value (-107) is higher on the graph than the larger value (‑102) because a smaller negative number is described as a higher matric potential. The pressure is orders of magnitude lower at the top of the graph than the bottom of the graph.