
13.3 Evaporation, Transpiration, and Precipitation
Evaporation
Where liquid water exists at the Earth’s surface, water molecules are continually exchanged between the liquid phase and the atmosphere. Evaporation occurs when the number of water molecules passing to the vapor state in the atmosphere exceeds the number joining the liquid phase. The rate of evaporation is based on the energy in the system, which is related to the water temperature as well as the temperature, pressure, and humidity of the air above the water. Humidity refers to the amount of moisture in the air; ways of expressing humidity include the following.
- Absolute humidity: total mass of water per unit volume of air.
- Saturation humidity: maximum mass of water a unit volume of air can hold at a given temperature and pressure.
- Relative humidity: absolute humidity divided by the saturation humidity (i.e., the percent ratio of the amount of moisture in the air to the maximum it could hold).
Evaporation from lakes and rivers, and even directly from the groundwater, is a significant flux in the water cycle and must be considered in water‑budget studies. Evaporation rates from a lake or a reservoir can be determined indirectly by measuring the inflows, outflows, and changes in storage in the lake, and using the continuity equation to calculate the evaporation portion. This can be challenging because it is difficult to reliably measure rates and volumes of water that are entering or leaving a groundwater system that is hydraulically connected to a lake.
Evaporation can be measured directly using shallow pans of water that are exposed to the atmosphere. Evaporation pans are maintained throughout the US by the National Weather Service (Arkansas–Red Basin River Forecast Center, 2023) for constant monitoring of evaporation rates. Water is maintained in these pans at a fairly constant depth, and the amount of water added to the pan by the operators, as well as by precipitation, is used to calculate evaporation rates.
One of the complications of using pans to estimate the amount of water that would evaporate from a nearby reservoir is that the pan absorbs heat from the sun much more readily than the reservoir. Therefore, pan measurements overestimate the rate of evaporation. Pan evaporation rates must be multiplied by a pan coefficient, which is a number less than 1 (usually somewhere between 0.5 and 0.8) to develop more meaningful evaporation rates that can be used in water balance studies.
Transpiration
Plants are constantly pumping water from the ground into the atmosphere through a process called transpiration. Plants take up water for growth—that is, for building plant tissue—but only a small percentage of what they take up gets used, while the rest is released to the atmosphere through leaves and needles. Transpiration is a difficult thing to quantify; it varies with the time of the day—mostly, transpiration takes place during daylight hours, when photosynthesis is occurring—and time of year. Different plant species take up water at different rates.
Transpiration is significant wherever plants exist. In some cases, transpiration rates can be so high that they drastically reduce the amount of water in streams and serve as a major discharge flux in shallow groundwater systems and wetlands. Plants called phreatophytes extend their roots down into the saturated zone, and some of these can remove water at extremely high rates, stressing the groundwater system in a manner similar to pumping wells. Other types of plants are xerophytes, which are shallow rooted plants that live in desert areas and require little water, and hydrophytes, which are aquatic plants that live directly in water.
Evapotranspiration
In practice it is very difficult to separate water lost to evaporation from transpiration losses; therefore, for groundwater models and water balance studies we usually lump them together as evapotranspiration (ET). To understand this concept, we need to distinguish between potential evapotranspiration and actual evapotranspiration.
Potential evapotranspiration is the water loss that would occur if an unlimited supply of water were available for transpiration and evaporation. In reality, the amount of water that transpires or evaporates is limited by the amount of water that is available. If the amount of water available is less than the potential evapotranspiration, then the actual evapotranspiration will be lower than the potential.
Figure 101 shows an example relationship between precipitation and potential/actual ET for the northern hemisphere with a warm, dry summer and a cool, wet fall/winter/spring. In the summer months, when precipitation is low, there is not enough water to satisfy the potential; therefore, the actual ET is less than the potential.
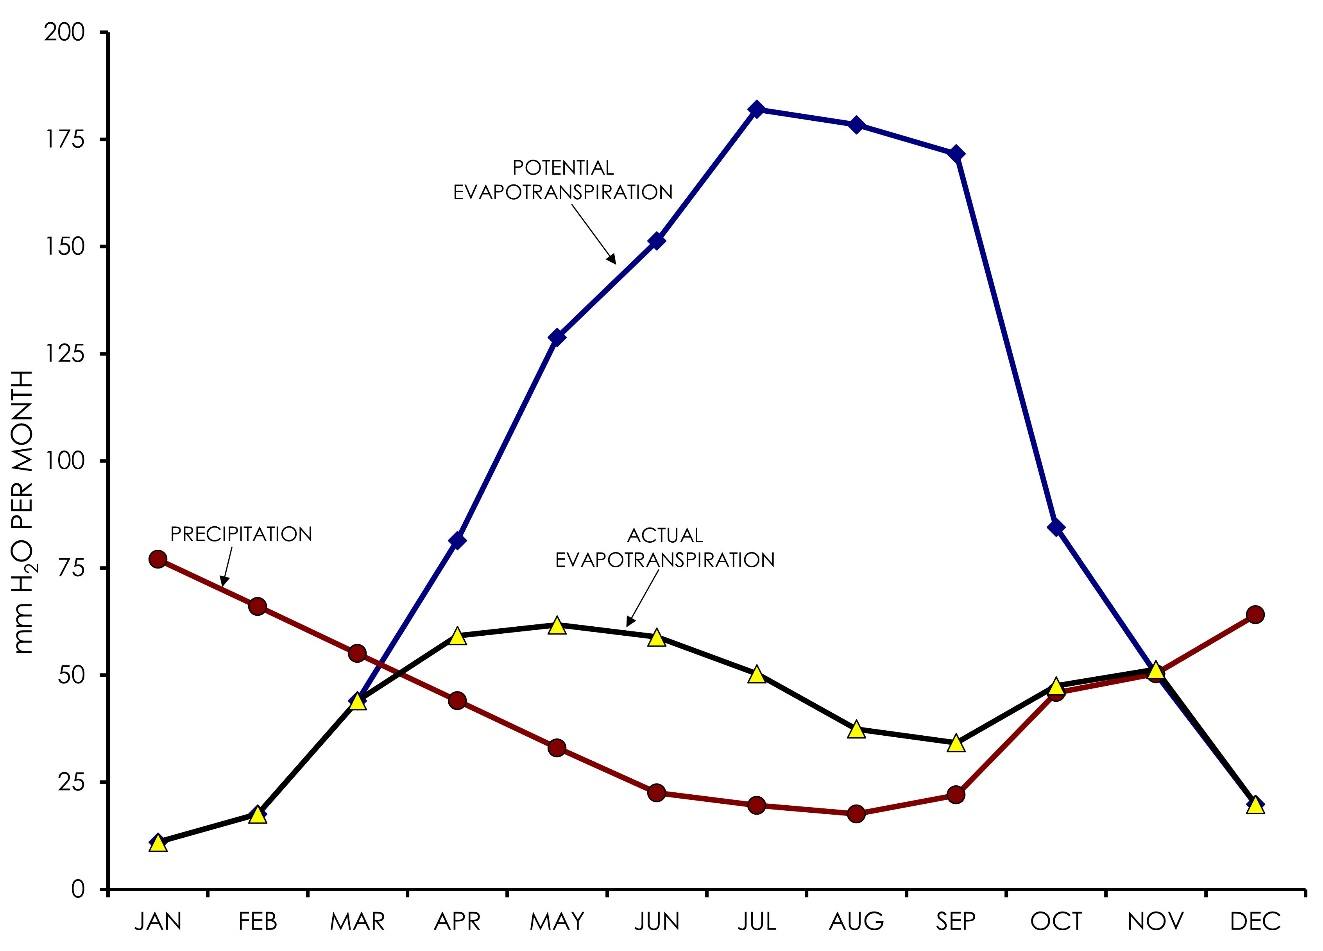
Figure 101 ‑ Graph of hypothetical data showing an example relationship between potential evapotranspiration, actual evapotranspiration, and precipitation in the northern hemisphere with a warm, dry summer and a cool, wet fall/winter/spring.
Actual ET cannot exceed the potential, but if precipitation and the capacity of the soil to store water are both low, then actual can be much less than potential. In areas where precipitation is more evenly distributed throughout the year, actual ET will be close to potential ET. This is important because we can measure potential evaporation—that is, pan evaporation—and determine potential transpiration for specific plants, but we must acknowledge that the potential will not be reached if there is not enough water available.
Precipitation
As masses of air cool, the saturation humidity decreases and the relative humidity increases. When the relative humidity approaches 100 percent condensation begins to occur. Condensation is initiated on particles of dust or ice crystals suspended in the air and can form clouds. When air masses rise, they expand; as they expand, they cool, and water condenses. If enough water condenses, it will exceed the air’s capacity to hold it and water falls out as precipitation.
The amount of rain that falls during a storm is usually measured in terms of a depth. This depth refers to the depth of water that is left in a rain gauge after the storm. In theory, if we know the depth at any given point, and the area of the watershed upon which rain fell, we can estimate the volume of water that fell in the drainage basin during the storm. The rate and the total depth of precipitation, however, will vary from place to place in an area during a storm. When attempting to determine the volume of rain that actually falls in a watershed, we need to calculate an average precipitation, or effective uniform depth (EUD) of precipitation for the watershed.
If the rain gauge stations are distributed evenly throughout the area of interest, each gauge will represent an equal area of the watershed. In that case, we can take the arithmetic average of all the rainfall values at each station to estimate an effective uniform depth. Unfortunately, rain gauges are never evenly distributed throughout a watershed, and we need to adjust the values so that an EUD can be determined. There are several ways of doing this; two of the more popular methods are presented below.
- Isohyet method: Isohyetal lines are lines of equal rainfall. These are drawn on a map of the watershed just like any contour map. The area bounded by adjacent isohyets is measured, and the average depth of the two isohyets is applied to that area. The areas are then weighted and averaged based on the relative size of each isohyetal area. Figure 102 shows an isohyetal map. One advantage to using this method is that it is easy and does not require specialized software or other equipment. A disadvantage of this method is that, since the distribution of rain is never the same, a new map must be redrawn with each rain event.
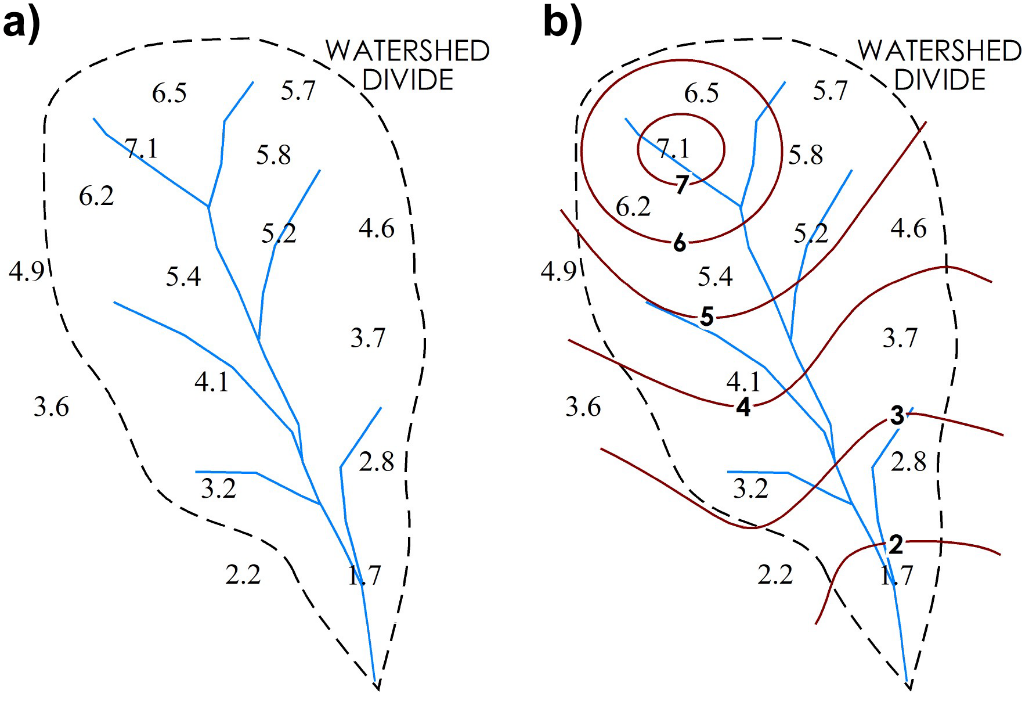
Figure 102 ‑ a) Watershed map with rainfall data from several gauges. b) Isohyetal lines drawn on the map.
- Thiessen method: This is similar to the previous method, except that it weights the areas around each gauge rather than areas between rainfall contours. The Thiessen method delineates areas that include all points closer to each gauge than to any other gauge in the basin. To determine the zone containing all points closest to each station, first adjacent stations in the watershed are connected with a network of lines. Then a perpendicular line is drawn at the midpoint of each of the network lines. These perpendicular-bisectors are extended until they intersect with the nearest perpendicular-bisector, thus creating a set of polygons covering the area. The area of each polygon is measured, and its fraction of the total area is determined. The rainfall depth at each station is multiplied by the fractional area represented by that rain gauge, and these are summed to determine the EUD. Figure 103 shows the development of a Thiessen polygon map. The advantage of the Thiessen polygon method is that you only need to calculate the weighting factors for the gauge stations once, then they can be used to calculate EUD for any storm or for each year.
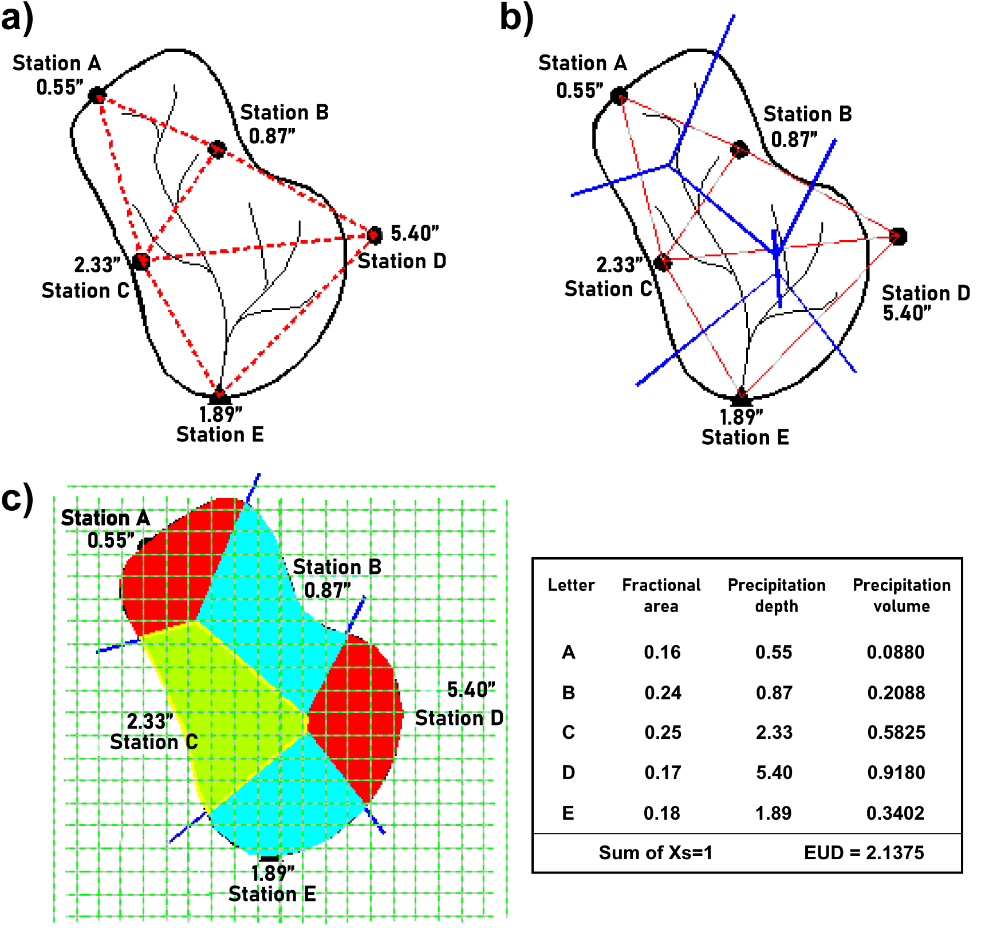
Figure 103 ‑ Development of a Thiessen polygon map for a rain gauge network. a) Lines (red dashed) are drawn connecting the gauge locations. b) A perpendicular line (solid blue) is drawn at the midpoint of each line. c) The perpendicular lines are extended until they connect to form polygons and the fractional area of each polygon is determined then multiplied by the precipitation recorded at the gauge within that polygon (reproduced from Arkansas–Red Basin River Forecast Center [ARBRFC], 2023).
These methods have limitations in mountainous areas, where orographic effects can create vastly different microclimates over short distances. In such areas, detailed studies of vegetation or more detailed rain gauge coverage is needed to properly determine the distribution of rainfall.