Exercise 11
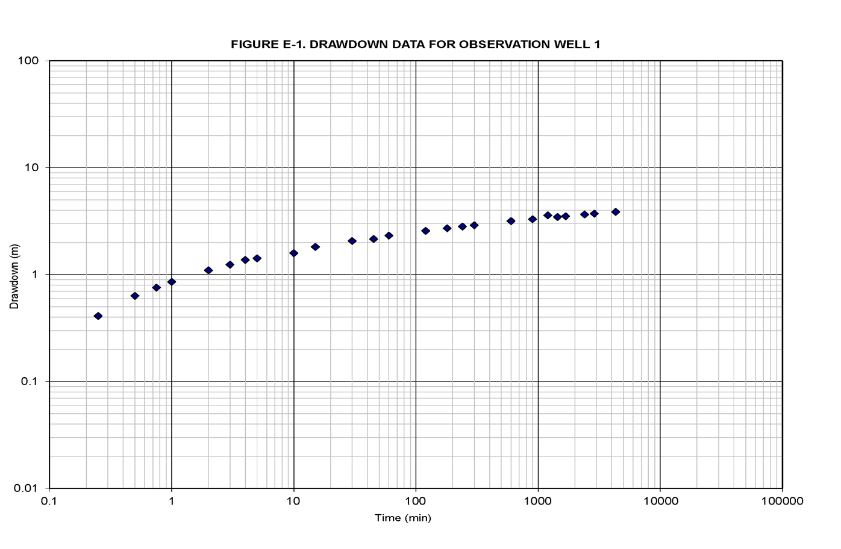
This image shows time‑drawdown data from a multi‑well aquifer test that involved one pumping well and one observation well. The data are from the observation well located 20 meters from the pumping well. The pumping well was pumped at 100 m3/d for 72 hours.
Assume the aquifer is a fully confined sandstone with a constant saturated thickness of 20 m.
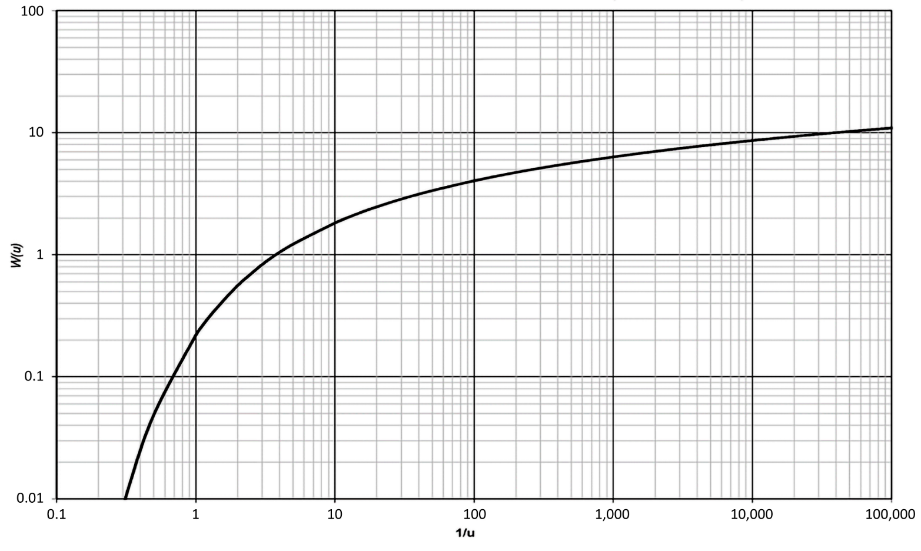
- Manually fit the data to the Theis type curve provided below it.
- Then, for [latex]t[/latex] = 1 and[latex]\ s[/latex] = 1, select match points for 1/[latex]u[/latex] and [latex]W(u)[/latex] and calculate [latex]T,\ S[/latex], and [latex]K[/latex] for the test.
- Provide the values of t, s, 1/u, W(u) for the selected match point and show the calculations to determine T, S, and K.