Exercise 13
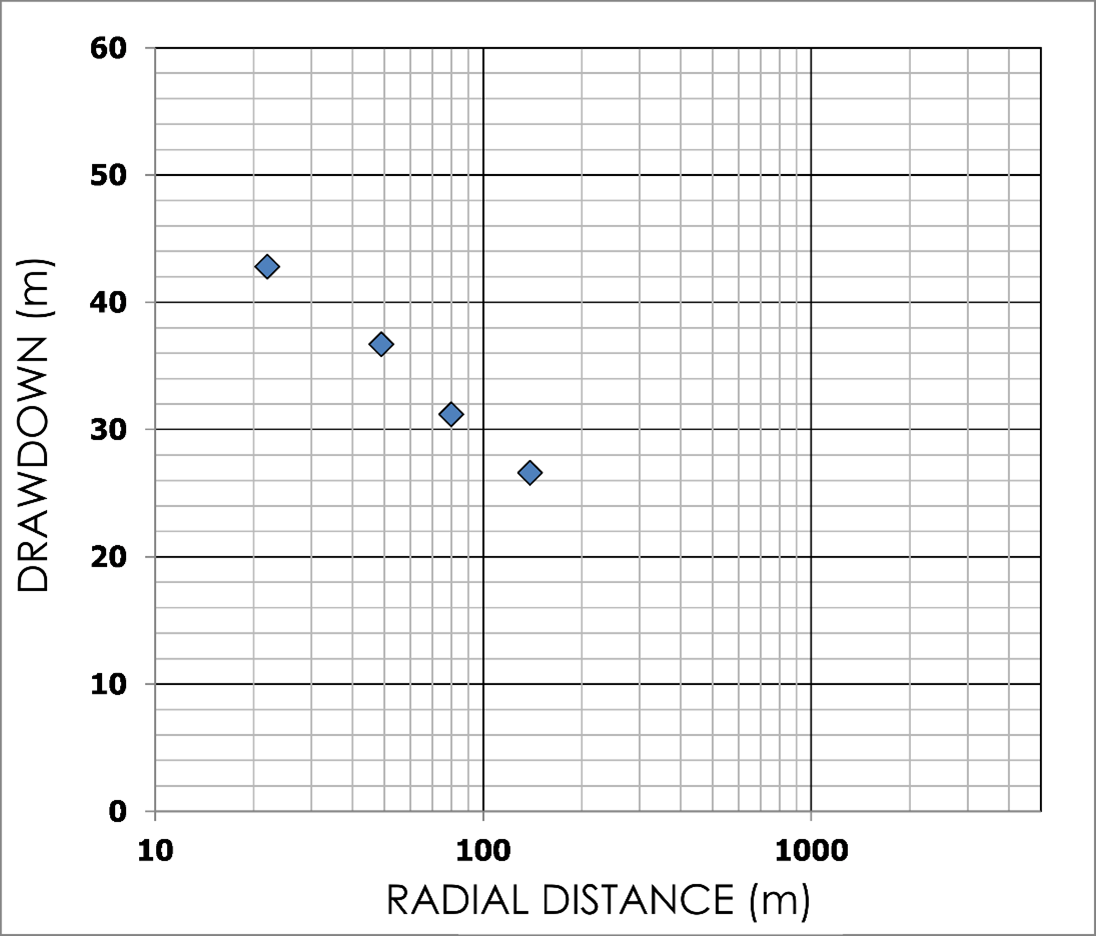
A well is pumped at 200 m3/d for 24 hours. Drawdowns are measured in four observation wells located at distances ranging from about 20 to about 140 meters from the pumping well. The table shows the distance to each well and drawdown in that well 24 hours after pumping began. The graph shows the drawdown data on a linear scale as a function of distance on a semi-log scale. Use the Cooper–Jacob simplification of the Theis equation to determine [latex]T[/latex] and [latex]S[/latex] for the formation.
| Distance from PW | Drawdown |
|---|---|
| m | m |
| 22 | 42.8 |
| 49 | 36.7 |
| 80 | 31.2 |
| 139 | 26.6 |