
11.3 Development of Cones of Depression in Anisotropic Heterogeneous Material
The simplifying assumptions needed to develop analytical solutions to forecast drawdown and analyze hydraulic testing data state that the unit being pumped is isotropic and homogeneous. This allows for radial flow and the development of mathematics to produce analytical solutions. However, uniform aquifer parameters within the cone of depression may not be present in many settings. Instead, the geologic setting and depositional and structural history often result in anisotropic and heterogeneous conditions. In such cases, the cone of depression is not symmetrical when the aquifer is pumped (Figure 77).
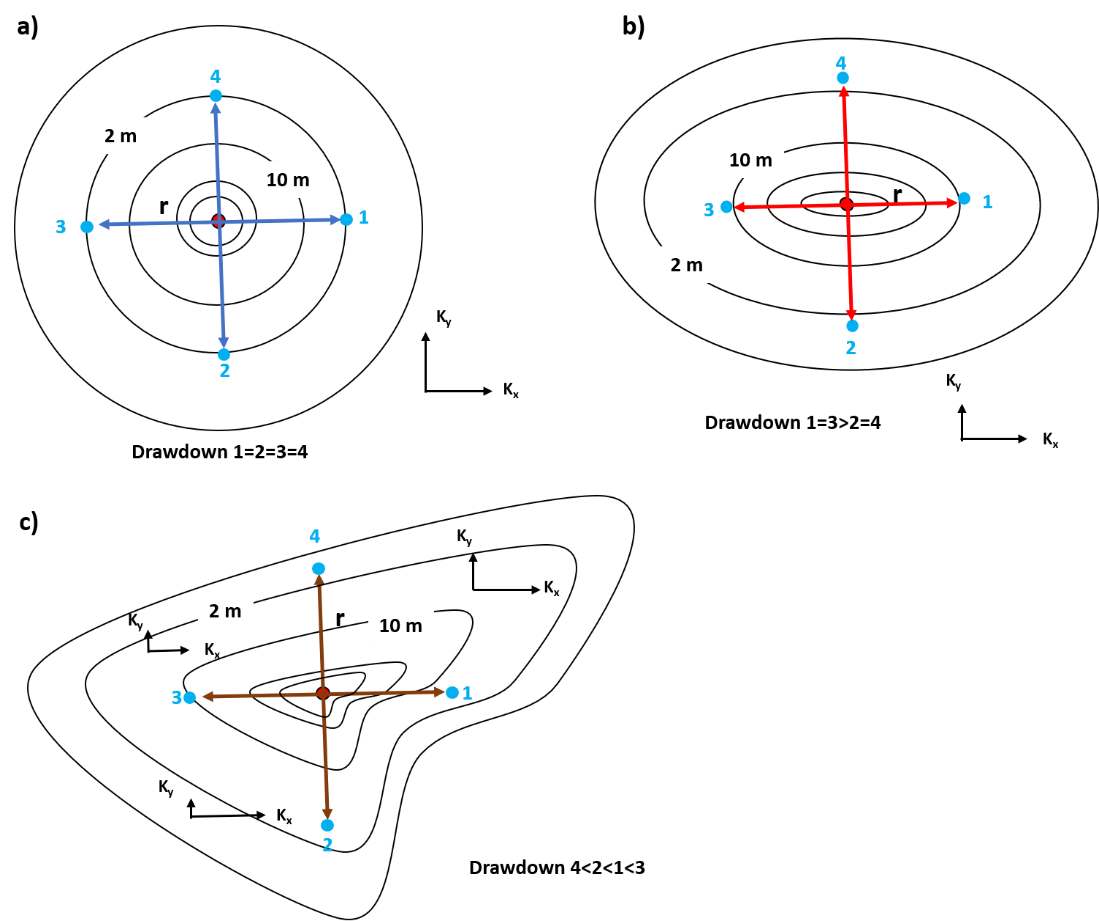
Figure 77 ‑ Schematic map views of cones of depression (two‑dimensional) associated with a pumping well in a water‑bearing unit with a) isotropic homogeneous, b) anisotropic homogeneous, and c) anisotropic heterogenous conditions. The red solid dot represents a pumping well. Solid blue dots represent observation wells numbered 1, 2, 3, and 4, located at equal radial distances (r) from the pumping well. Maps represent drawdown at a specified time. The cone of depression associated with pumping in isotropic and homogeneous conditions shown in (a) has equal drawdown at observation wells located at equal distances from the pumping well. The cone of depression associated with pumping in anisotropic homogeneous conditions (b), where Kx>Ky has an elongated shape in the direction of the x axis (higher hydraulic conductivity) and the drawdown cone is narrower and steeper in the y direction which is the direction of lower hydraulic conductivity. The cone of depression associated with a pumping well in anisotropic heterogeneous conditions (c) has different drawdown at each well even though they are located at the same radial distance from the pumping well.
The cone of depression becomes less symmetrical and drawdown at equal distances from the pumping well varies more as hydraulic properties of the pumped unit are more anisotropic and heterogeneous (Figure 77). When conditions are heterogeneous and anisotropic, T and S computed from observation well time‑drawdown data collected at equal distances from the pumping well will be higher or lower than the isotropic, homogeneous case. This is illustrated in a conceptual semi‑log plot of time‑drawdown data from observation wells located at equal radial distances (r) for a pumping well in Figure 78.
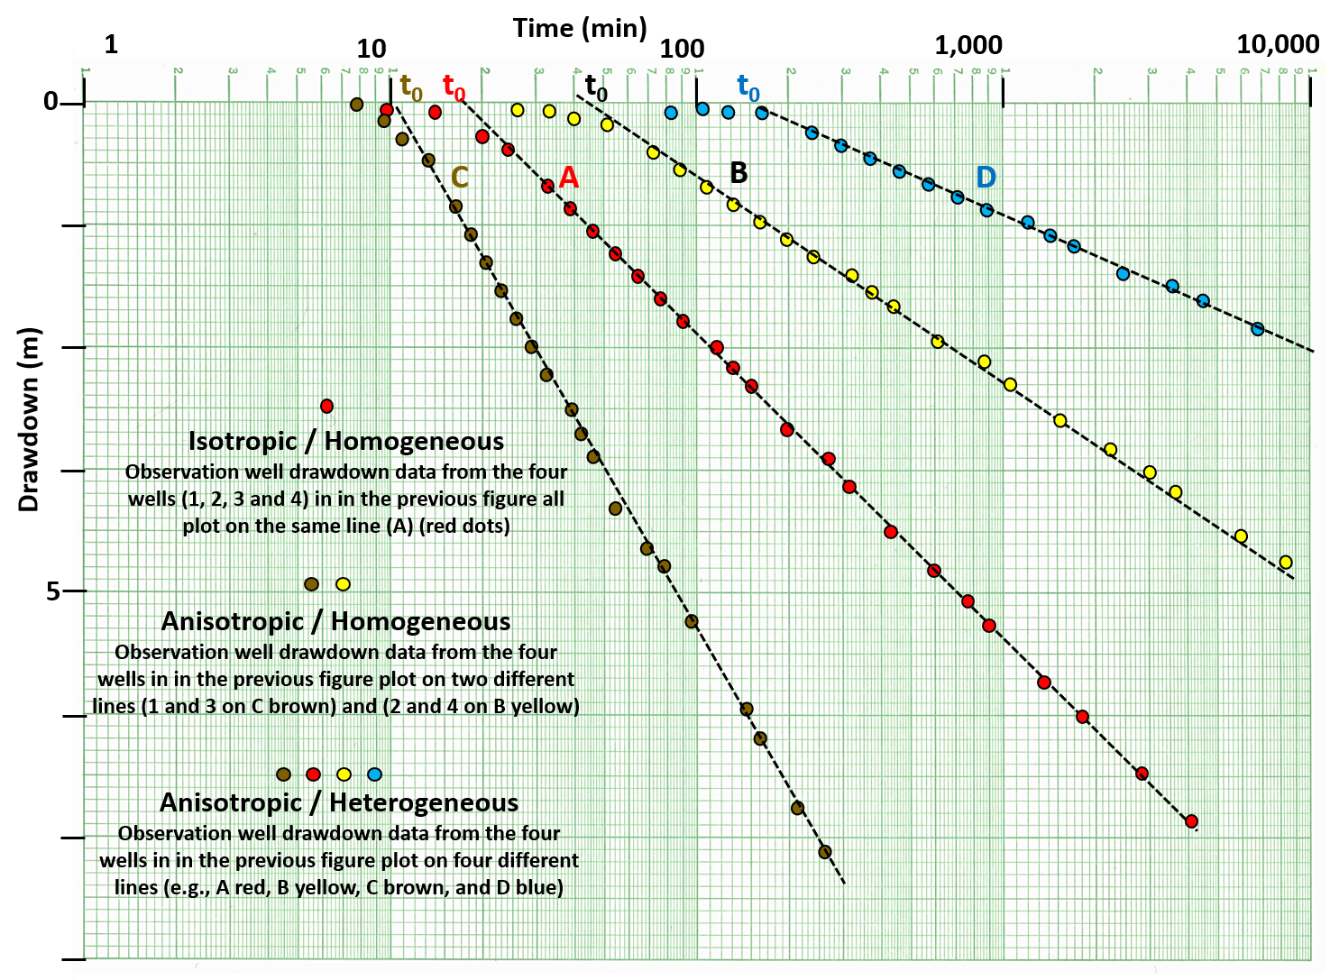
Figure 78 ‑ Conceptual semi‑log plot of time‑drawdown data for equally spaced observation wells (Figure 77) collected for hydraulic tests conducted in a totally confined groundwater system. The straight‑line portion of the curves from different observation wells equidistant from the pumping well have different slopes and t0 intercepts as T and S are more variable. Plot A represents drawdown data collected under isotropic and homogeneous conditions. Drawdown data from each of the four observation wells plot along the line passing through the red dots. Under simple anisotropic conditions drawdown data from two observation‑wells located along the axis of lower hydraulic conductivity plot on one line (e.g., B, yellow dots) and the other two observation‑well data sets plot on a different line (e.g., C, brown dots). In an anisotropic and heterogeneous case, data from each observation well plot on a separate line (e.g., A, B, C, and D).
As most field conditions are not isotropic and homogeneous, T and S values derived from multiple observation wells will not be equal. Most often, for a test with multiple observation wells, the resulting values are averaged or high, low, and average values of parameters are used to forecast groundwater conditions. Use of the high and low values indicates the degree of uncertainty in the forecasted conditions.
In some settings, observation wells are not available when conducting pumping tests. The next section addresses how estimates of hydrogeologic properties of groundwater systems can be derived using only a single pumping well.