
14.3 Field Data: Overdamped, Underdamped and Critically Damped Water‑Level Responses to Slug Tests
The water‑level response (displacement) from a slug test can be classified as overdamped, underdamped, or critically damped (Figure 103).
Overdamped recovery occurs when the ratio of the normalized head (i.e., the unrecovered water level Ht divided by the initial maximum water level at the start of the test, H0) declines logarithmically as shown in Figure 109. When overdamped slug‑test data are plotted as the logarithm of the ratio Ht/H0 versus time, a portion of the data form a straight line that can be used to extract information for the appropriate equation to calculate K (e.g., Hvorslev, 1951) as discussed in Section 14.4.1). However, Butler (1996, 1998) notes that the selection of the straight‑line portion can be complicated when the plot has more than one straight section. Some plots have two straight sections, a very early straight portion and a second at later times (Figure 109).
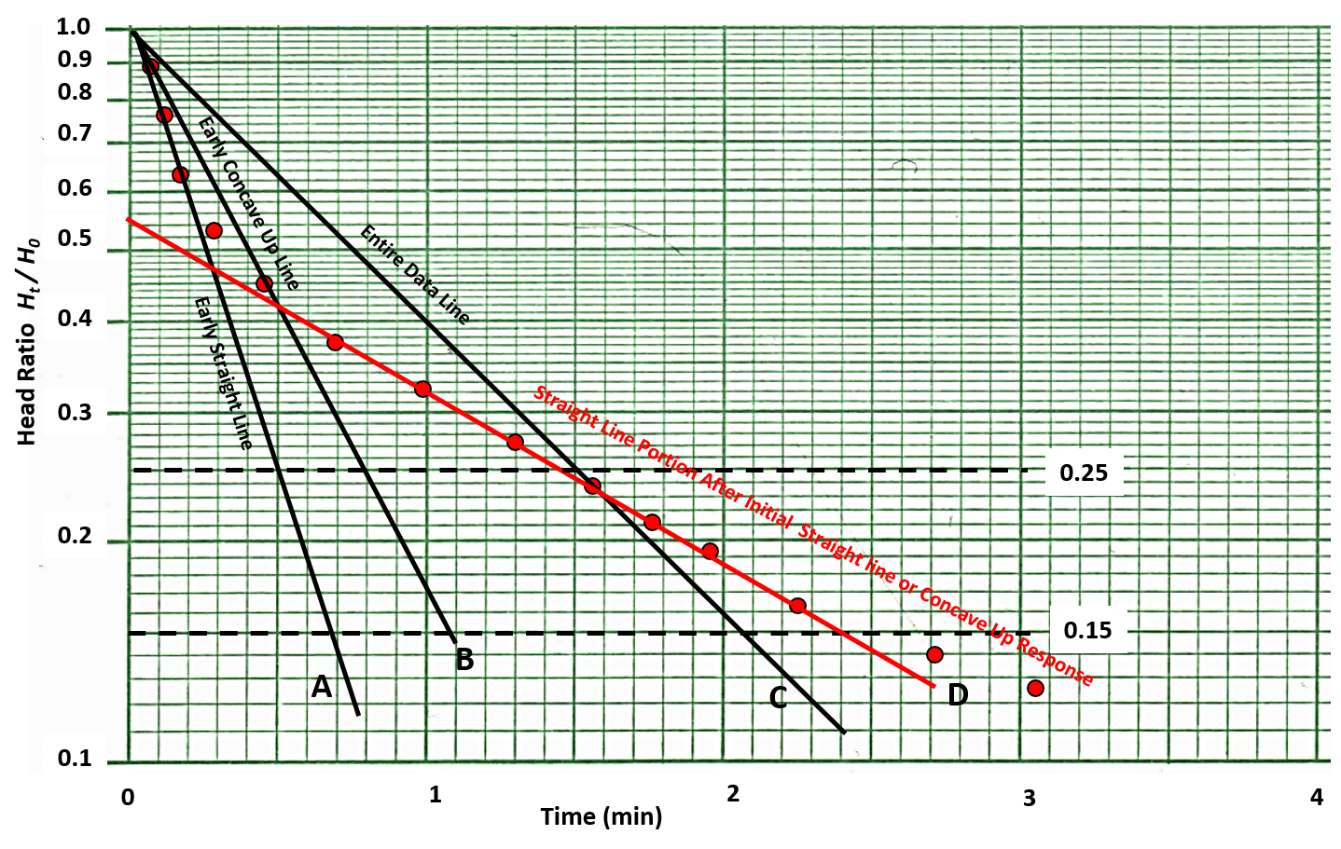
Figure 109 ‑ Schematic of an overdamped slug‑test data set that exhibits an early straight‑line and a concave upward trend. In this example, fitted lines A, B and C have greater slopes than the red line D, which is considered to be representative of the formation properties (Butler, 1996). Early time data fitted with line A most likely reflects the release of water from a gravel pack or leakage of water down a poorly sealed well bore. The concave upward portion of the curve shows elastic storage is an early component of the observed water level change. The fitted line B incorporates this trend. When the entire data set is fit to a straight line, C, the calculated hydraulic conductivity will be higher than the formational value because the effect of the gravel pack and storage are included in the response. Line D is fit to the straight‑line portion of the plot that occurs after the effects of leakage or gravel pack effects no longer dominate the data. Butler (1996) recommends that when early data trends occur, the straight‑line portion should be selected using the second straight‑line section of the data. He suggests that the data between head ratio values of 0.25 and 0.15 (dashed black lines) should be used to represent the formational properties, line D.
Very early time data that form an initial straight‑line section is often related to the release of water from a gravel‑packed well or from water leaking down an unsealed well bore (Figure 107). Butler (1996, 1998) recommends not misinterpreting an early‑time trend as representative of formational response. Butler (1996) suggests that when the early straight‑line portion or a concave‑upward trend is present, a line should be fit to the remaining straight‑line portion of the data set. He suggests this portion should be encompassed by the 0.25 to 0.15 values of the head ratio (Figure 109). Butler’s (1996) analyses of a data set showed when the Hvorslev method (Hvorslev, 1951) was applied using the straight‑line portion between 0.25 and 0.15 values of K were within 5 percent of values obtained using another type‑curve slug‑test method (Cooper et al., 1967).
Early‑time data can also exhibit a concave‑upward trend (Figure 109). This trend often reflects the effects of formation storativity (elastic storage) on the early recovery data. This section of data should be ignored when fitting a line to the data, and the second straight‑line portion of the data should be used to represent formation water‑level response. For some data sets, a second approach can be applied that does not rely on straight‑line interpretations and accounts for storage (i.e., Cooper et al., 1967; Hyder et al., 1994).
When slug‑test responses are overdamped, depending on the hydrogeologic properties of the material, the length of the test can vary. For higher hydraulic conductivity, smaller maximum head change, and longer perforated intervals, water‑level recovery will be more rapid. In extremely low‑permeability material, full recovery may require weeks or longer.
Overdamped slug‑test data for confined aquifers can also be plotted as the ratio of Ht/H0 versus the log of time and matched to type curves developed by Cooper and others (1967) as shown in Figure 110. An early curved slope is interpreted as a response to formation storativity. Methods to analyze these data are presented in Section 14.4.
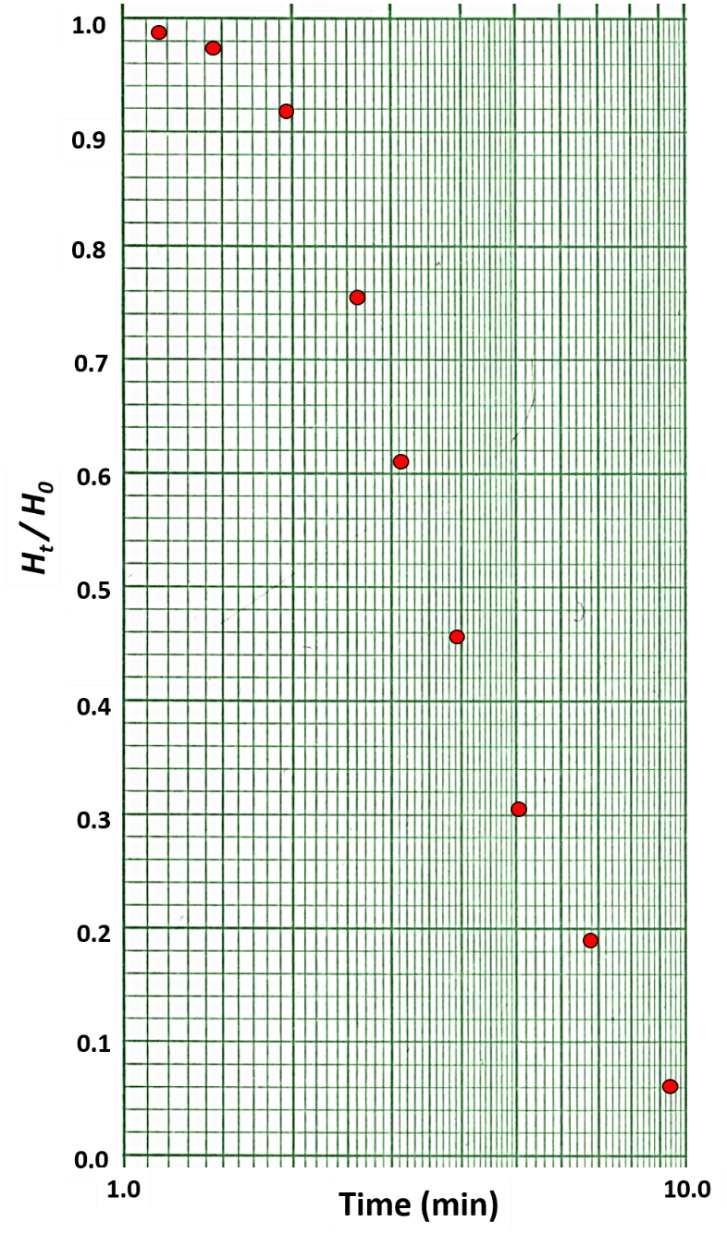
Figure 110 ‑ Example of slug test data for a confined aquifer plotted as Ht/H0 versus the log of time. Analysis of the data is completed by curve matching as described by Cooper and others (1967).
Underdamped water‑level responses yield an oscillatory response (Figure 103b). The water‑level changes decay exponentially until the initial static condition is realized. This response is most often observed when wells penetrate high hydraulic conductivity groundwater systems. Tests often are completed within 10s of seconds. Section 14.5 describes methods developed to analyze test data displaying an underdamped response.
Butler (1998) notes that slug‑test responses sometimes show a transitional response between the overdamped and underdamped conditions (Figure 103c). This state is referred to as critically damped. The curve shows a concave‑downward curvature at later times especially when plotted as the log of head versus time. Analysis techniques applied to this transitional data can be addressed using overdamped or underdamped analytical approaches. Butler (1998) and Butler and others (2003) discuss analysis of critically damped data sets.